Introduction
This brief is the first of a series of articles seeking to examine the current state of the private long-term care insurance (LTCI) industry. The articles will leverage company-submitted data from the Long-Term Care Experience Reporting Forms (ERFs) of the National Association of Insurance Commissioners (NAIC). As the ERFs underwent significant restructuring for 2020 year-end reporting, our articles will generally focus on information that will continue to be available going forward under the new design. The prior ERFs primarily concentrated on collecting data for standalone LTCI policies. We expect to expand these briefs in the future to cover the growing presence of hybrid LTCI policies, where more data from those policies will be collected under the new ERF design. This brief uses 2019 ERF data. We anticipate adding in 2020 ERF data for future briefs.
This first brief focuses on the overall size of the standalone private LTCI industry with respect to lives, claims, and benefits. In the sections that follow, we put the ERFs under the microscope1 to illustrate the size of private LTCI and how it has changed over the last decade.
Covered lives
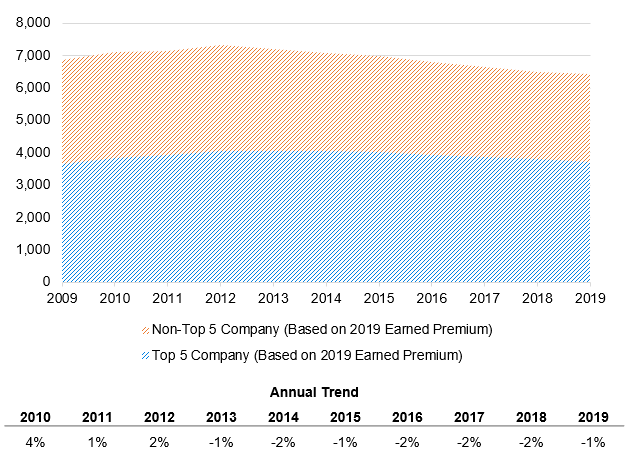
Nearly 6.5 million individuals have LTC insurance coverage through a private LTCI policy as of 2019. The number of covered lives has remained relatively steady over the last decade, but has been declining in recent years. Policy terminations have outpaced new policy issues by about 125,000 individuals per year over the last seven years, which is primarily attributable to overall declining new sales during that period. When sorting companies from high to low by earned premium in 2019, nearly 60% of all private LTCI policyholders are covered by one of the top five largest issuers (see Figure 1). The top five insurers based on 2019 in-force premium include Genworth, John Hancock, Northwestern Mutual, MetLife, and Unum.
Figure 1: Private LTCI covered lives by calendar year and company size (thousands)
Claim counts
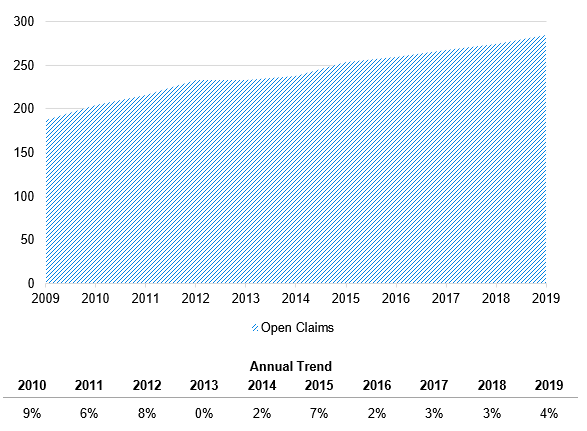
While the number of covered lives has been decreasing in recent years, a historical tally of open claims tells a different story. A net increase of 10,000 open claims per year has occurred since 2009 as policyholders age and approach the time when care is most common (see Figure 2). Over the last decade, this has accumulated to more than a 50% increase in open private LTCI claims.
Figure 2: Count of open private LTCI claims by calendar year (thousands)
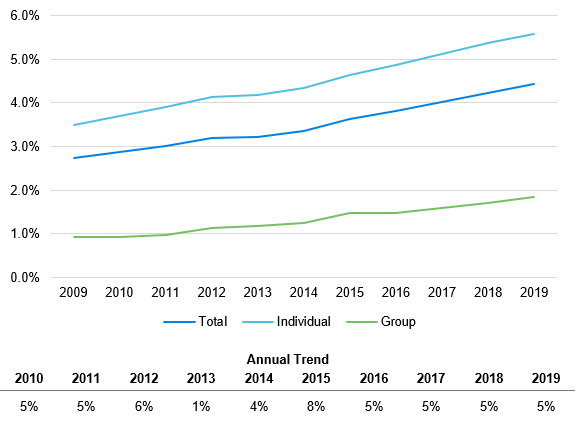
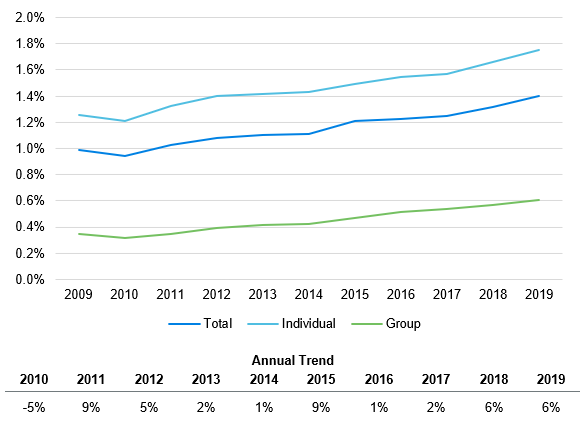
Because total policyholders covered are showing a gradual decline while open claim counts increase, prevalence (i.e., the percentage of total covered lives with an open claim) has consistently increased—see Figure 3. Similarly, incidence (i.e., the percentage of total covered lives with a new claim each year) has ticked up—see Figure 4.
When examining trends further by individual and group business, Figures 3 and 4 show prevalence and incidence are generally higher for individual business. Potential causes for this relationship include differences in insured characteristics, such as:
- Average attained age. Group business generally has lower average attained age than individual business, which could yield lower prevalence and incidence rates.
- Average policy year. Group business may have been issued more recently on average compared with individual business, which could also yield lower prevalence and incidence rates.
Figure 3: Prevalence rate by line of business, open private LTCI claims as % of covered lives
Figure 4: Incidence rate by line of business, new private LTCI claims as % of covered lives
Benefit dollars
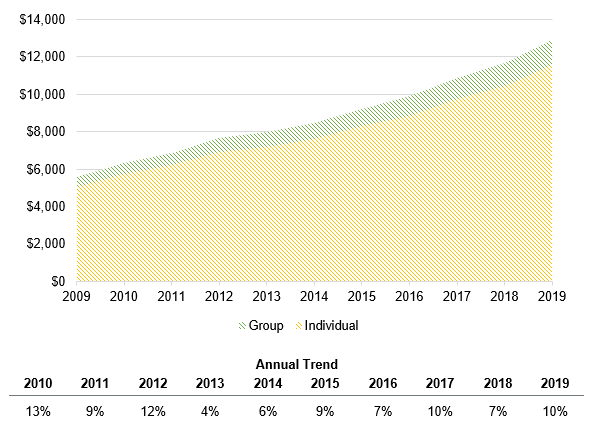
While the growth in open claim counts certainly points to the changing size of private LTCI as a payer for LTC services, the striking growth in annual benefits incurred over the last decade underlines this point. Figure 5 illustrates this growth—a 130% cumulative increase over the last decade, reaching $12.9 billion in annual claims for 2019. Claims incurred under individual LTC plans dominate the graph, representing approximately 90% of all claim dollars in 2019. Individual LTC plans generally exhibit more claims due to a larger number of covered lives and older policyholders compared to group LTC plans.
Figure 5: Annual incurred private LTCI claims by line of business ($ millions)
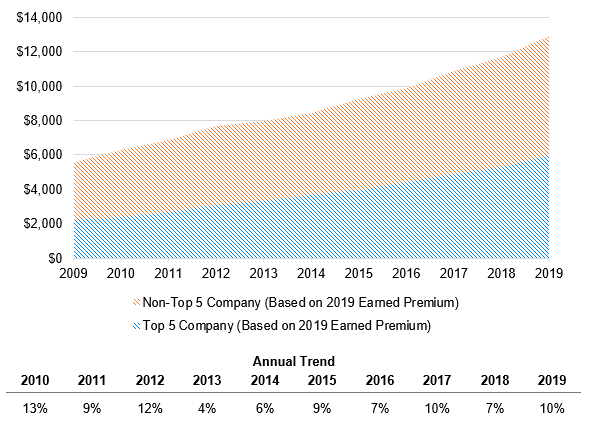
Additionally, as Figure 6 shows, more than 46% of 2019 claims are from the five largest issuers—a percentage that has been increasing over the last decade. It is worth noting, however, that these five largest insurers are also responsible for nearly 60% of covered lives (as shown in Figure 1 above).
Figure 6: Annual private LTCI claims by company size ($ millions)
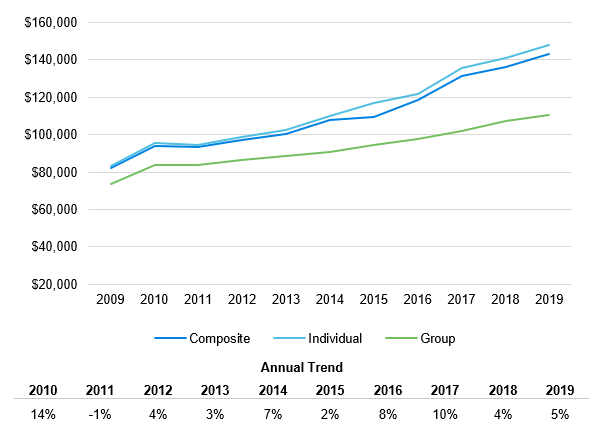
The increase in annual incurred claims is not only attributable to the growth in claimant counts, but also to the growth in the average size of claims. As seen in Figure 7, the average claim size has increased from roughly $80,000 in 2009 to $140,000 in 2019. The 5% to 6% annualized increase in average claim size likely has multiple causes, such as:
- Growing pool of money. Individuals who have a policy with inflation protection have access to a larger pool of benefits year over year.
- Increasing length of stay. Individuals may be remaining on claim and collecting benefits for a longer period than in past years.
- Rising cost of care. As the daily average cost of LTC services has increased, so has the average claim size.
Figure 7: Average private LTCI claim size by line of business
Conclusion
The need for long-term care services across the country has grown steadily over the last decade as Americans continue to age. This trend can also be clearly seen in the growth of claims in the private LTCI industry. While still a relatively small payer for long-term care services when compared to the Medicaid program, the LTCI industry is responsible for almost $13 billion in annual claims and growing and covers over six million individuals nationwide.
1All data in this article comes from company-submitted 2019 year-end NAIC Long-Term Care Experience Reporting Form 1.
