First-time home buyers, vacation home purchasers, downsizers—and even those with no interest in buying a home at all—took notice of the appreciation in the housing market that took off at the end of 2020 and that continues through to today. Whether upgrading to accommodate working from home, moving to more affordable suburban locales, or wanting to be closer to family, buyers have fueled an ultracompetitive housing environment. This has translated into a surge in the S&P’s national home price index, which recorded a record high growth rate of 18.6% year-over-year in June 2021.1
With home prices hitting such high levels of growth, many people are reminded of the last time this type of phenomenon occurred, in the mid-2000s, and the corresponding global financial crisis that engulfed the United States. Several publications warn of a similar outcome, stating that home prices are due for a sharp correction.2,3 However, after reviewing the data, there is a key difference this time around: appreciation is not being driven by loose underwriting and speculation, as was the case in 2007, but rather by a constrained supply of inventory coupled with material and labor shortages.
In this article we use Milliman’s Mortgage Default Index to evaluate whether the risk profile of borrowers today and the risk profile of borrowers from the mid-2000s are comparable; to better understand whether there is potential for history to repeat itself.
The Milliman Mortgage Default Index4 (MMDI) is a lifetime default rate estimate calculated at the loan level for a portfolio of single-family mortgages. For purposes of this index, default is defined as the probability that a loan becomes 180 days or more delinquent. For example, if a loan has an index value of 14%, this means that the loan has a 14% probability of defaulting over the life of the mortgage.
The components of the MMDI that inform default risk are borrower risk, underwriting risk, and economic risk. Borrower risk measures the risk of the loan defaulting due to borrower credit quality, initial equity position, and debt-to-income (DTI) ratio. Underwriting risk measures the risk of the loan defaulting due to mortgage product features such as amortization type, occupancy status, and other factors. Economic risk measures the risk of the loan defaulting due to historical and forecasted economic conditions.
For this analysis, we extend the MMDI back to the early 2000s using data from a mortgage data vendor that includes originations from Freddie Mac, Fannie Mae, and private-label security loans; the 2020-2021 loans are sourced from publicly available securities data published by Fannie Mae, Freddie Mac, and Ginnie Mae.
The value of MMDI for loans with an origination date of January 1, 2007, is estimated to be 17.18% (indicating a lifetime 180-day default rate of approximately one out of every six loans), with purchase and refinance loans having default scores of 21.89% and 14.33%, respectively. Purchase loans generally have higher credit risk relative to refinance loans as refinance loans have lower average loan-to-value ratios. For comparison, loans with an origination date of January 1, 2021, have an index value of 2.70% (indicating a lifetime 180-day default rate of approximately one out of 40 loans), with purchase loans and refinance loans at 3.01% and 2.56%, respectively. Figure 1 shows the MMDI of 2007 and 2021 and the different components.
Figure 1: Summary of MMDI components

Figure 2 is an interactive graph that shows the MMDI over time as well as the different components. The loan purpose toggle allows for a more granular look at just purchase or refinance loans.
Before reading into the values too much, it is important to note that much of the difference in the MMDI value is due to economic conditions. We now have the benefit of hindsight for 2007 originations. Therefore, we do not have a true apples-to-apples comparison related to economic risk like we do the other risk components. Economic differences will be further discussed in this article after we decompose borrower and underwriting risk. The sections below deconstruct the key drivers of the index value for the different origination dates.
Borrower risk results: 2021 Q1 vs. 2007 Q1
We deconstruct the MMDI into various components to help understand the drivers of risk from period to period. The first component we evaluate is borrower risk, which we measure as the unique combination of a borrower’s original credit score, loan-to-value ratio, and debt-to-income ratio.
In 2007, the MMDI value for borrower risk was estimated to be 4.74%. This indicates, prior to adjusting for any high-risk loan attributes or economic factors, that we would expect approximately one out of 20 loans to have experienced a 180-day default event over the life of the loans. Looking more granularly at the data, the MMDI value for borrower risk on purchase loans was estimated to be 7.98%, while the MMDI value for borrower risk on refinance loans was estimated to be at 2.78%. For comparison, in 2021 the MMDI value for borrower risk is estimated to be 2.70% (a reduction of 45%, or approximately one out of 37 loans). The MMDI value for borrower risk on purchase loans is estimated at 2.47%, and refinance loans at 1.87%. The main driver for the high values of borrower risk in 2007 were predominantly due to low credit scores and high debt-to-income ratios.
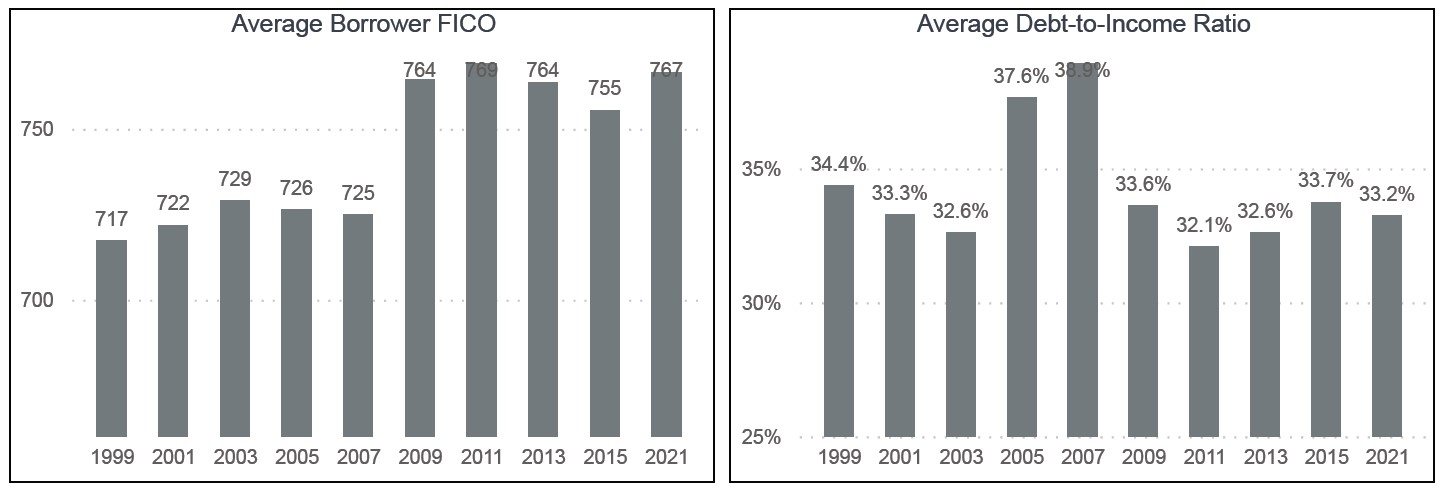
Figure 3 breaks down the FICO Score and debt-to-income (DTI) ratio by year. The average FICO score in 2007 was 725 versus 767 in 2021. The average DTI ratio was 38.9% in 2007 and 33.2% in 2021. From this data, we estimate that borrowers in 2007 were at higher risk of default at origination relative to borrowers in 2021.
Figure 3: Breakdown of borrower risk components
Underwriting risk results: 2021 Q1 vs. 2007 Q1
The second component we evaluate is underwriting risk, which is measured by looking at the risks associated with the mortgage features such as the type of mortgage product, occupancy status, amortization features of the mortgage, and other characteristics.
In 2007, the MMDI value for underwriting risk was estimated to be 3.16%. The MMDI value for underwriting risk on purchase loans was estimated to be 3.74%, while the MMDI value for refinance loans was estimated to be 2.81%. In 2021, the MMDI value for underwriting risk is 0.18%, while the MMDI value for purchase loans is estimated to be -.02%, and for refinance loans 0.26%.
Figure 4 illustrates the underwriting risk component broken out by high loan-to-value ratio (LTV) and low LTV. High LTV is defined as a LTV greater than 80%, and conversely low LTV is a LTV less than or equal to 80%. The higher proportion of the underwriting component in 2007 is predominantly driven by the high amount of cash-out refinance loans.
Figure 4: Breakdown of underwriting risk components
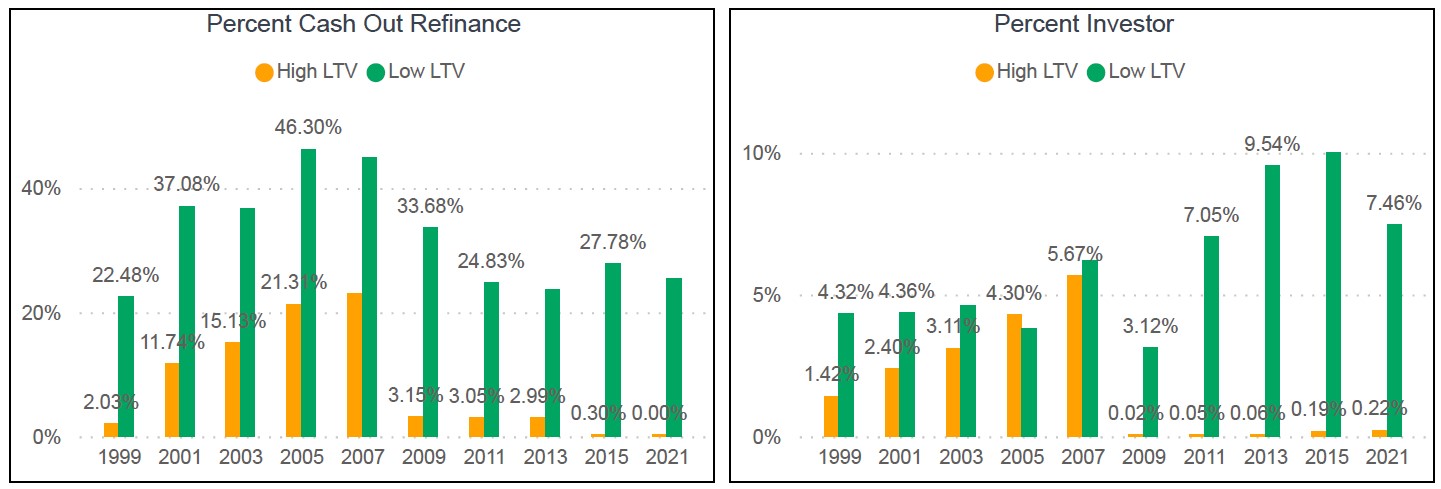
According to Freddie Mac, “a cash-out refinance Mortgage is a Mortgage in which the use of the loan amount is not limited to specific purposes.”5 In other words, this is a refinance mortgage where the borrower takes equity out of the property, often for reasons beyond home equity or improvement.
Leading up to the global financial crisis, cash-out refinance mortgage loans were a significant driver of risk, as many borrowers extracted equity from their homes for a variety of reasons. During this time, borrowers were able to borrow up to 100% of the value of the home, essentially creating a new, zero-equity loan. Historical data indicates that, the lower the amount of equity in a home, the greater the risk of default, especially when home values see a decline in value. After the global financial crisis, Freddie Mac and Fannie Mae implemented an 80% LTV cap on cash-out refinance loans, limiting default risk to this segment of borrowers.
In addition to a high amount of cash-out refinance loans, there was also a significant amount of high LTV loans that were used to purchase investment properties. Historical data indicates that, all else equal, investment properties have a higher probability of default compared to primary residences. In 2007, there was a higher proportion of high LTV investment properties whereas in 2021 almost all investment properties are exclusively low LTV. Just as cash-out refinance loans have become more difficult to qualify for, so have loans for investment properties due to underwriting changes implemented to limit risk.
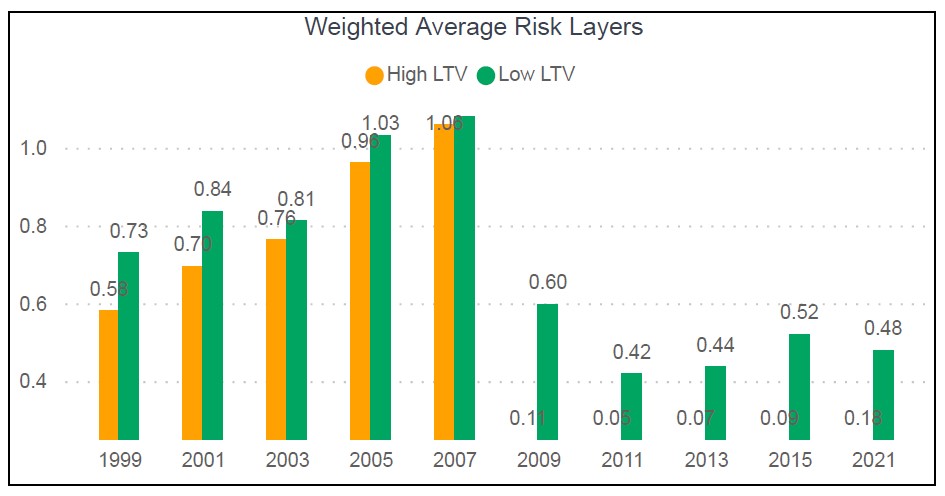
Following the global financial crisis, there was a broad objective to reduce what is known as risk layering. For example, assume there are six indicators of a high-risk loan: (1) the LTV is greater than 80%, (2) the credit score is less than 680, (3) the DTI ratio is greater than 45%, (4) the loan purpose is a cash-out refinance, (5) the property is a multiunit property, and (6) the loan is for an investment property. If a loan has all six of these characteristics, it is said to have six risk layers. The more risk layers, the higher the risk of default. Figure 5 shows the weighted average risk layer by year broken out by high and low LTV. From this chart, we see a dramatic reduction in risk for both high and low LTV loans as a result of tighter underwriting standards. In 2007, the average loan had at least one risk factor. From 2009 onward, the average risk factor decreased and stayed below historical averages.
Figure 5: Total risk layers
Economic risk results: 2021 Q1 vs. 2007 Q1
The MMDI calculates economic risk by looking at historical and forecast economic data. When evaluating the 2007 originations, we have the benefit of hindsight in knowing that home prices declined by 30%, which may not have been fully understood at the time. Our current forecast is for continued home price appreciation (HPA) for new originations. With that in mind, the comparison of economic risk of loans that originated in 2007 (using actual history) to loans originated today (using a baseline economic forecast) is not an apples-to-apples comparison. Therefore, in this section, we focus on comparing additional data outside of home prices to evaluate the potential risk in the market.
While there has been considerable appreciation in home prices recently, the growth rate experienced in the five years leading up to the global financial crisis was higher than the same period leading up to today. Figure 6 shows cumulative growth in HPA from 2002 to 2007 and 2016 to 2021, respectively. From the first quarter of 2002 through the first quarter of 2007, home price appreciation averaged 49.35% nationally (some regions experienced greater growth than this). From the first quarter of 2016 through the first quarter of 2021 home price appreciation averaged 30.58%. So while home price growth has been robust, appreciation still trails the era immediately before the global finance crisis.
Figure 6: Change in HPA
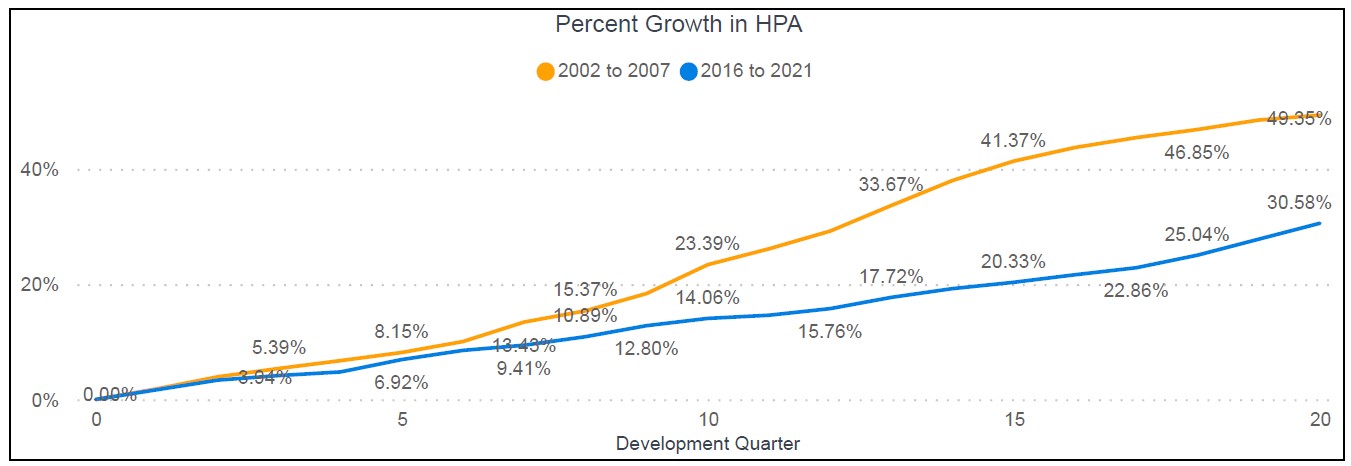
The above charts take the growth development of HPA from 2002Q1 through 2007Q2 and 2016Q1 through 2021Q2 respectively. For example, the HPA growth at development month 15 takes the HPA from 2005Q4 over the values from 2002Q1 and 2019Q4 values over 2016Q1 values.
Another factor to consider is median household income and particularly differences between growth in home prices relative to growth in income. If home prices increase faster than income growth, there is a greater potential for affordability issues and potential home price corrections. Figure 7 shows the five-year growth of median household income from 2002 to 2007 and 2016 to 2021. Aside from a few quarters during the COVID-19 global pandemic, household income grew at a faster rate from 2016 to 2021 than from 2002 to 2007. The greater growth in income supports some of the home price appreciation recently observed in the market.
Figure 7: Change in median household income
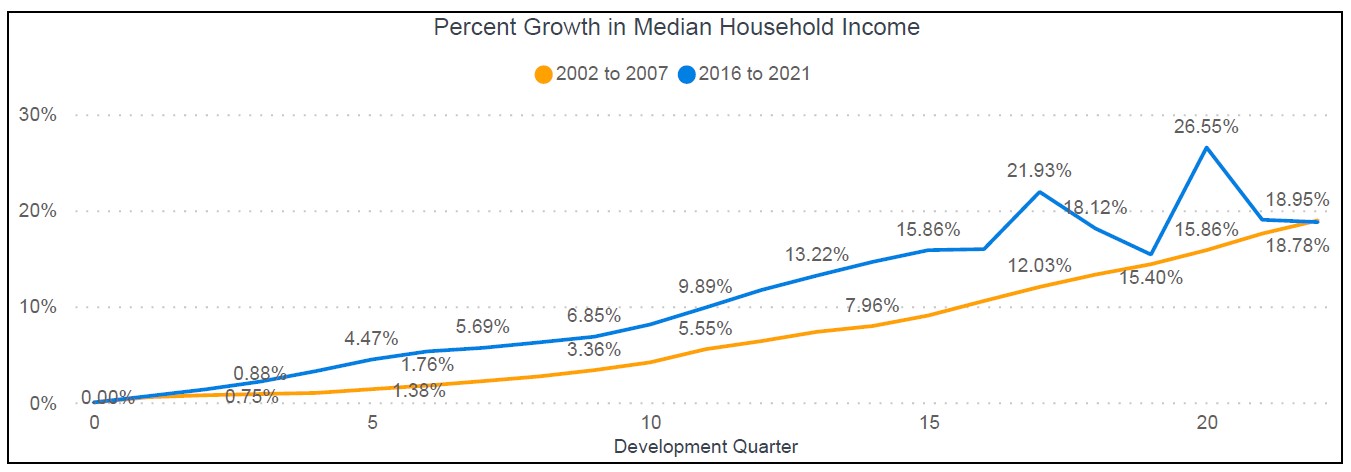
The above charts take the growth development of Median Household Income from 2002Q1 through 2007Q2 and 2016Q1 through 2021Q2 respectively. For example, the Median Household Income growth at development month 15 takes the Median Household Income from 2005Q4 over the values from 2002Q1 and 2019Q4 values over 2016Q1 values.
Another often-discussed driver of recent home price appreciation is the current constraint on the supply of homes available for sale in the market. Figure 8 shows the home supply index as provided by the U.S. Census Bureau and U.S. Department of Housing and Urban Development.6 The months of supply ratio is defined as: “the ratio of houses for sale to houses sold. This statistic provides an indication of the for-sale inventory in relation to the number of houses currently being sold. The months’ supply indicates how long the current for-sale inventory would last given the current sales rate if no additional new houses were built.” The months of supply ratio on June 1, 2007, was 8.2; meaning that if no further homes were built, based on the current demand, the supply would last 8.2 months. In June 2021, the supply ratio was just 6.1, and this is an increase from just 3.5 in 2020. Because of the lower supply ratio, we would expect home prices to naturally rise in 2021.
Figure 8: Home Supply Ratio
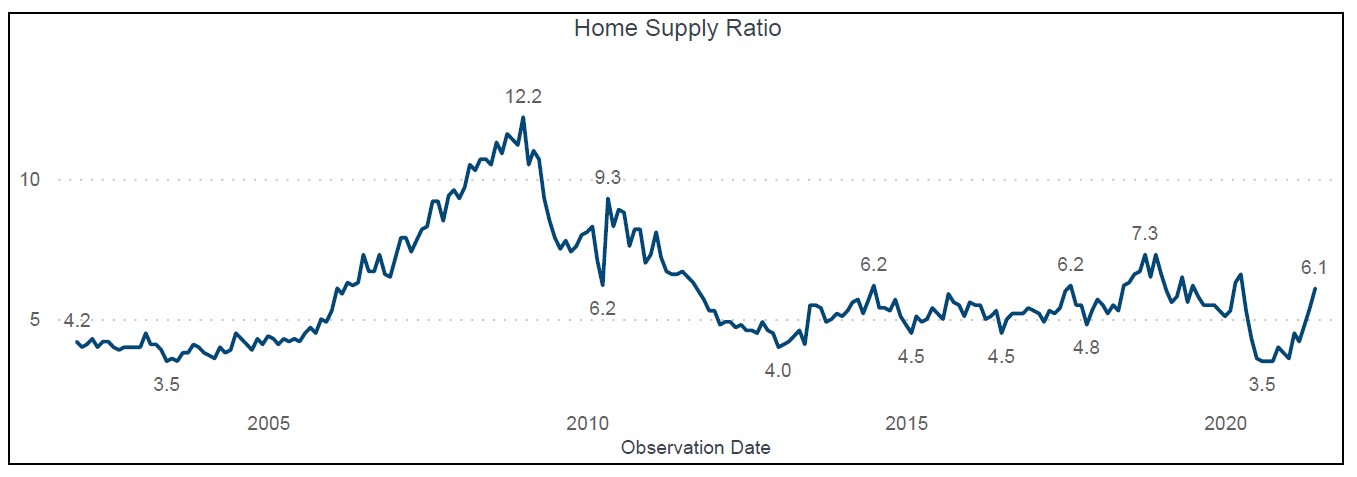
Demand for housing has remained consistent or has potentially increased during the pandemic. Basic economic principles hold that if supply of a good decreases and demand increases (or stays constant), we would expect the price of the good to increase. This was certainly observed during the pandemic as the supply of housing contracted.
Conclusion
Based on the above information, we see the following trends in the data:
- The risk profile of the average borrower today is much lower relative to the risk profile of the average borrower for the period preceding the global financial crisis; and therefore today’s borrower is less likely to default compared with borrowers in the mid-2000s
- The number of high-risk attributes on mortgages originated today are significantly lower relative to the number of high-risk attributes on mortgages originated preceding the global financial crisis
- The economic drivers of home price appreciation are more supply-constrained as opposed to demand-driven today, relative to the period preceding the global financial crisis
While it may be foolish to say “this time is different,” the key drivers of home price appreciation and the risk profile of mortgages underwritten today are fundamentally different from those prior to the global financial crisis. Based on this data, we do not believe we are headed for a similar repeat in home price movements and default events in the mortgage market. It is certainly an interesting time for the housing market, and it is not clear how home prices will react when supply returns to the market. It is possible we will see some areas with declines in home prices or slower appreciation, but nationally we do not anticipate significant declines in home prices over the next several years. Even if there is a decline in home prices or slower price appreciation, the favorable borrower and underwriting risks in the housing market should tamp down the likelihood of mortgage defaults, ultimately reducing the likelihood of another crisis within the mortgage market.
To stay up to date on housing trends, visit Milliman.com/MMDI to see our quarterly Milliman Mortgage Default Index updates.
1Fung, A. (August 31, 2021). US home price growth surges at fastest rate in more than 30 years. Yahoo Finance. Retrieved October 10, 2021, from https://finance.yahoo.com/news/case-shiller-home-price-june-2021-130002781.html.
2Lisa, A. (September 21, 2021). 40 cities that could be poised for a housing crisis. Yahoo Finance. Retrieved October 10, 2021, from https://finance.yahoo.com/news/40-cities-could-poised-housing-160002702.html.
3Measom, C. (September 26, 2021). Should you prepare for a housing market crash in 2021? Yahoo Finance. Retrieved October 10, 2021, from https://finance.yahoo.com/news/prepare-housing-market-crash-2021-120008854.html.
4Glowacki, J.B. & Brelih, J. (August 2021). Milliman Mortgage Default Index: 2021 Q1. Retrieved October 10, 2021, from http://www.milliman.com/mmdi.
5Freddie Mac. Chapter 4301: Cash-out Refinance Mortgages. Retrieved October 10, 2021, from https://guide.freddiemac.com/app/guide/section/4301.5.
6U.S. Census Bureau and U.S. Department of Housing and Urban Development. Monthly Supply of Houses in the United States. FRED, Federal Reserve Bank of St. Louis. Retrieved October 10, 2021, from https://fred.stlouisfed.org/series/MSACSR.