The Milliman Mortgage Default Index (MMDI) is a lifetime default rate estimate calculated at the loan level for a portfolio of single-family mortgages. For the purposes of this index, default is defined as a loan that becomes 180 days or more delinquent.1 The results of the MMDI reflect the most recent data acquisition available from Freddie Mac, Fannie Mae, and Ginnie Mae, with measurement dates starting from January 1, 2014.
COVID-19 effects on mortgage risk
Interact with the MMDI

To explore the MMDI data on a more granular level, including loan origination and type, click here.
Significant uncertainty continues regarding how mortgage performance may be affected by the COVID-19 pandemic and its associated economic impacts. While unemployment rates, delinquency rates, and the percentage of loans in forbearance have increased rapidly since the start of the pandemic (and remain at elevated levels), the housing market has remained resilient. Please refer to prior releases of the MMDI,2 as well as recent Milliman articles on the topic,3 for more detailed discussions of the potential impact of the pandemic on mortgage performance.
The current unique combination of a sudden shift to remote work and historically low interest rates has partially contributed to a surge in purchase and refinance originations. This, coinciding with tight housing supply, has resulted in above-average home price appreciation. As home equity is the largest driver of mortgage defaults, these trends contribute to lower default rates.
Key findings
During the fourth quarter (Q4) of 2020, mortgage demand continued to rise, with Freddie Mac and Fannie Mae mortgage volume increasing more than 132% year-over-year, hitting record volume in the quarter. Default risk of mortgages remained consistent with the prior quarter.
When reviewing the total default risk quarter-over-quarter, particularly components related to the borrower risk (i.e., the credit profile of borrowers) and underwriting risk (i.e., specific loan and property features that increase or decrease default risk), the MMDI for government-sponsored enterprise (GSE) acquisitions—loans acquired by Freddie Mac and Fannie Mae—was generally consistent, at 1.27% for loans originated in 2020 Q4 compared to 1.28% for loans originated in 2020 Q3. Figure 1 provides the quarter-end index results for these loans segmented by purchase and refinance.
FIGURE 1: MMDI 2020 Q4 DASHBOARD FOR GSE LOANS

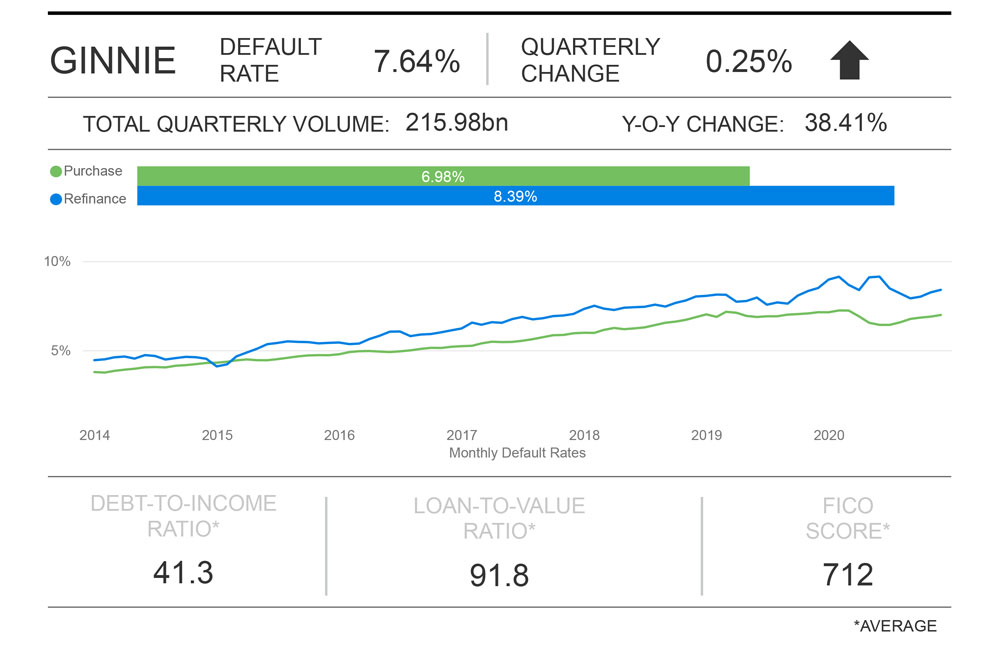
The MMDI for Ginnie Mae loans increased from 7.39% in 2020 Q3 to 7.64% in 2020 Q4, as can be seen in Figure 2 (segmented by purchase and refinance). For certain types of refinance loans (i.e., streamlined refinance loans), Ginnie Mae acquisitions do not receive an updated credit score. For the MMDI, a credit score of 600 is conservatively used to calculate the default risk on mortgages with a missing credit score. Because a large portion of volume was refinance volume, many Ginnie Mae loans are getting assigned a low credit score of 600.
FIGURE 2: MMDI 2020 Q4 DASHBOARD FOR GINNIE LOANS

When reviewing quarter-over-quarter changes in the MMDI, it is important to note that the 2020 Q3 MMDI values for GSE and Ginnie Mae acquisitions have been restated since the last publication, changing from 1.50% to 1.28% and 8.69% to 7.39%, respectively. This is a result of updating actual home price movements from forecasted values and updating home price appreciation forecasts with the most recent forecasts available. Since the start of the pandemic-induced shutdowns (March 2020), actual home price appreciation has exceeded expectations, resulting in consecutively lower restated values of the MMDI.
Agency summary
When comparing the most recent Freddie and Fannie acquisitions to the prior quarter, default risk was generally consistent with 2020 Q3 originations. For 2020 Q4, 71% of the mortgage volume was attributable to refinance loans, compared to 68% in 2020 Q3.
Loans guaranteed by Ginnie Mae experienced a slight increase in their default risk in 2020 Q4 relative to the prior quarter. Of the Ginnie Mae loans originated during this quarter, approximately 56% were refinance loans.
One area of potentially increased levels of risk in the mortgage market has been an increase is cash-out refinance mortgages over the past 12 months.
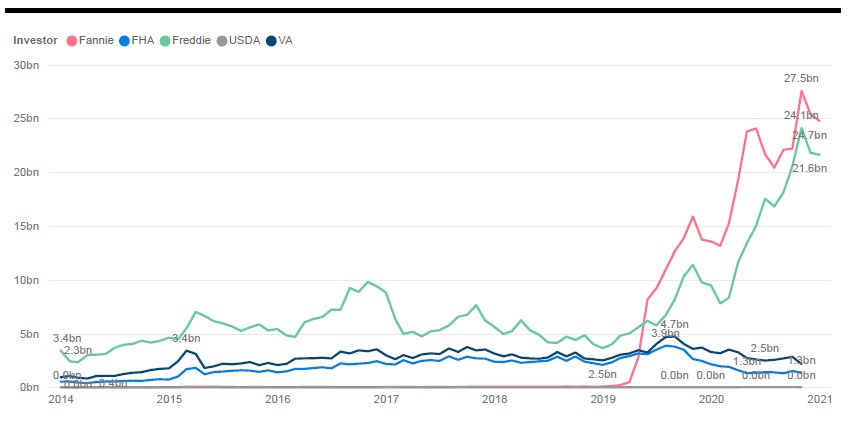
FIGURE 3: VOLUME BY INVESTOR

According to Freddie Mac, ”a cash-out refinance Mortgage is a Mortgage in which the use of the loan amount is not limited to specific purposes.”4 In other words, a refinance mortgage where the borrower takes equity out of the property. Leading up to the global financial crisis of 2007-2010, cash-out refinance mortgage loans were a significant driver of risk as many borrowers extracted equity from growing home prices.
During this time, borrowers were able to tap their equity for up to nearly the entire value of the home, adjusting their current loan-to-value (LTV) ratios from pre-refinance levels up to 100%. After the global financial crisis and in recognition of the risk posed by cash-out refinance loans, underwriting of these types of refinance loans was severely tightened and the volume of cash-out refinance loans fell. For example, Freddie Mac, Fannie Mae, and Ginnie Mae all limit the LTV ratio for cash-out refinance mortgages to 80% or lower, depending on other risk attributes of the mortgage.5 This significantly reduces the risk of default as the more equity a borrower has in the property, the lower the propensity for default.
Figure 3 shows cash-out refinance volume from Freddie Mac, Fannie Mae, and Ginnie Mae from 2014 through 2020 (note that, prior to 2019, the data from Fannie Mae did not segment rate/term refinance loans from cash-out refinance loans). Cash-out refinance mortgages average approximately $5 billion per month for Freddie Mac from 2014 through 2019 and approximately $2.5 billion per month for Ginnie Mae. Starting in 2019 and continuing through 2021, cash-out refinance volume increased significantly for Freddie Mac and Fannie Mae, exceeding $20 billion per month for the second half of 2020.
In Milliman’s models, the relativity of default risk for a mortgage with an original LTV ratio between 75% and 80% compared to a mortgage with an original LTV ratio between 85% and 90% is approximately 1.75 to 2.00. Therefore, while cash-out refinance loans are riskier, and have higher default rates, the absolute amount of default risk, all else equal, is managed by capping the LTV ratio of the mortgage.
One item to mention with respect to the capped loan-to-value ratios, however, is the increased use of automated waivers during the pandemic. This introduces some level of uncertainty around cash-out refinance loans in that there is a risk the actual LTV ratio is greater than the stated LTV ratio. Sources of biased appraisals include model risk (i.e., the model used to estimate the value of the property is not appropriately parameterized), incorrect input values into the model, and others. Of particular concern is the impact of the reduced level of inventory on home prices, which is currently resulting in higher home price appreciation. With little inventory, it is possible the models used for appraisal waivers are biased and do not reflect a steady-state housing market. To mitigate this risk, appraisal waivers are capped at a 70% LTV ratio, as opposed to 80%.
While cash-out refinance volume has increased significantly in 2020 and 2021, the default risks of the mortgages are mitigated by tighter underwriting standards, namely capped LTV ratios. To mitigate appraisal waiver risk, LTV ratios are further capped to mitigate risk. Milliman will continue to monitor the performance and volume of cash-out refinance loans. Currently, these mortgages do not appear to present a significant risk to the mortgage market.
Components of default risk
The components of the MMDI that inform default risk are borrower risk, underwriting risk, and economic risk. Borrower risk measures the risk of the loan defaulting due to borrower credit quality, initial equity position, and debt-to-income ratio. Underwriting risk measures the risk of the loan defaulting due to mortgage product features such as amortization type, occupancy status, and other factors. Economic risk measures the risk of the loan defaulting due to historical and forecasted economic conditions.
BORROWER RISK RESULTS: 2020 Q4
For GSE loans, borrower risk decreased in 2020 Q4 relative to 2020 Q3 from an average of 1.07% to 1.03%. The continued low level of borrower default risk in 2020 Q4 is largely attributable to the majority of loans being refinance, which has lower average LTV ratios and higher credit scores. For Ginnie Mae loans, borrower risk increased in 2020 Q4 relative to 2020 Q3 from an average of 5.82% to 5.87%. Ginnie Mae loans are generally lower credit score/higher loan-to-value ratio loans.
UNDERWRITING RISK RESULTS: 2020 Q4
Underwriting risk represents additional risk adjustments for property and loan characteristics such as occupancy status, amortization type, documentation types, loan term, and others. Underwriting risk after the global financial crisis remains low and is negative for purchase mortgages, which were generally full-documentation, fully amortizing loans.
ECONOMIC RISK RESULTS: 2020 Q4
Economic risk is measured by looking at historical and forecasted home prices. Actual home price appreciation has been robust from 2014 through 2020, which has resulted in embedded appreciation for older originations. This results in reduced credit risk for older cohorts. For more recent cohorts, we anticipate slower home price growth (or negative growth for some local geographies) after housing supply returns post-pandemic, which contributes to increases in economic risk for recent origination years.
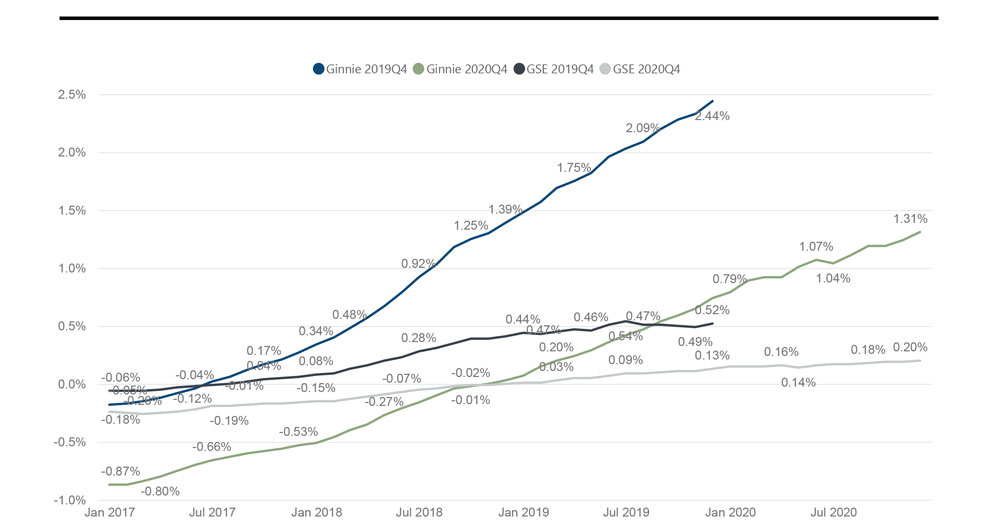
Figure 4 shows the economic risk component of the MMDI for Ginnie Mae mortgages and GSE mortgages as of 2019 Q4 and 2020 Q4. What we notice from the chart is that the economic risk component of the index has decreased significantly over the past year. This reflects significant home price appreciation over the past year as a function of steady housing demand and reduced supply. The pace of home price appreciation (in excess of 10% annually in some metro areas) has resulted in some market participants questioning the sustainability of future home price appreciation, with some market participants calling this market movement a "bubble."6
While the current level of robust home price growth is certainly a function of the pandemic and supply/demand imbalances, it is difficult to estimate how home prices may react “post-pandemic.” The MMDI reflects a baseline forecast of future home prices. To the extent actual or baseline forecasts diverge from the current forecast, future publications of the MMDI will change accordingly. Please read the disclaimer for COVID-19 for more context on economic risk.
FIGURE 4: ECONOMIC RISK BY INVESTOR AND ORIGINATION

About the Milliman Mortgage Default Index
Milliman is an expert in analyzing complex data and building econometric models that are transparent, intuitive, and informative. We have used our expertise to assist multiple clients in developing econometric models for evaluating mortgage risk both at point of sale and for seasoned mortgages.
The Milliman Mortgage Default Index (MMDI) uses econometric modeling to develop a dynamic model that is used by clients in multiple ways including analyzing, monitoring, and ranking the credit quality of new production, allocating servicing sources, and developing underwriting guidelines and pricing. Because the MMDI produces a lifetime default rate estimate at the loan-level, it is used by clients as a benchmarking tool in origination and servicing. The MMDI is constructed by combining three important components of mortgage risk: borrower credit quality, underwriting characteristics of the mortgage, and the economic environment presented to the mortgage. The MMDI uses a robust dataset of over 30 million mortgage loans, which is updated frequently to ensure it maintains the highest level of accuracy.
Milliman is one of the largest independent consulting firms in the world and has pioneered strategies, tools, and solutions worldwide. We are recognized leaders in the markets we serve. Milliman insight reaches across global boundaries, offering specialized consulting services in mortgage banking, employee benefits, healthcare, life insurance and financial services, and property and casualty insurance. Within these, Milliman consultants serve a wide range of current and emerging markets. Clients know they can depend on us as industry experts, trusted advisers, and creative problem-solvers. Milliman's Mortgage Practice in Milwaukee is dedicated to providing strategic, quantitative, and other consulting services to leading organizations in the mortgage banking industry. Past and current clients include many of the nation's largest banks, private mortgage guaranty insurers, financial guaranty insurers, institutional investors, and governmental organizations.
For more information and access to the loan-level detail, including seller, geographic, and channel break-outs, please visit the Milliman M-PIRe site and request a demo.
1For example, if the MMDI is 10%, then we expect 10% of the mortgages originated in that month to have become 180 days or more delinquent over their lifetimes.
2The MMDI report on 2019 Q2, for example, is available at https://us.milliman.com/en/insight/mortgage-default-index-2019-q2.
3See https://us.milliman.com/en/risk/mortgage.
4Freddie Mac. Chapter 4301: Cash-out Refinance Mortgages. Retrieved April 23, 2021, from https://guide.freddiemac.com/app/guide/section/4301.5.
5Freddie Mac. Chapter 4203: Maximum LTV, TLTV and HTLTV Ratios. Retrieved April 23, 2021, from https://guide.freddiemac.com/app/guide/section/4203.4.
6Olick, D. (April 13, 2021). ‘When is the housing market going to crash?’ is a red-hot search on Google – here’s why. CNBC. Retrieved April 23, 2021, from https://www.cnbc.com/2021/04/13/when-is-the-housing-market-going-to-crash-consumers-ask.html.