Public pensions hammered by COVID-19 economic impact; assets shed $419 billion in market value, sinking funded ratio to 66.0% in Q1 2020 for largest single quarterly drop in the history of Milliman Public Pension Funding Index
Funded status declines by $485 billion in first quarter 2020
The first quarter of 2020 was overrun by the economic impact of COVID-19.
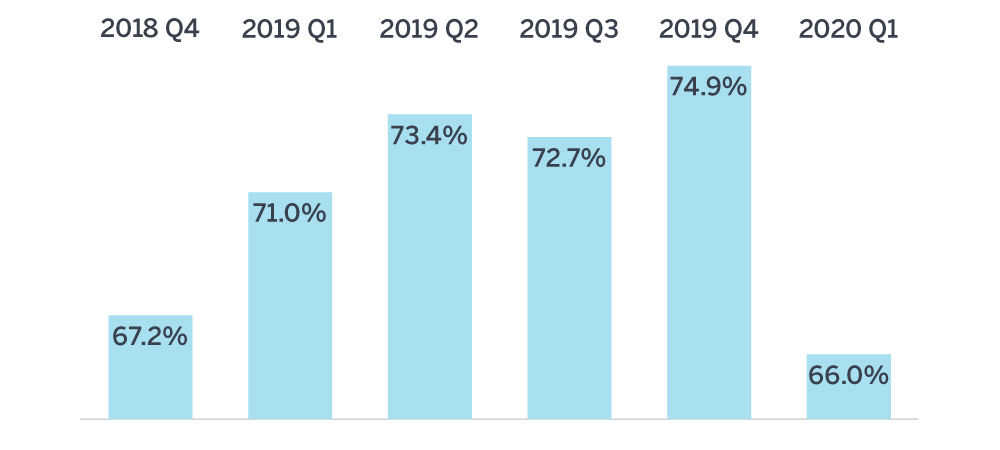
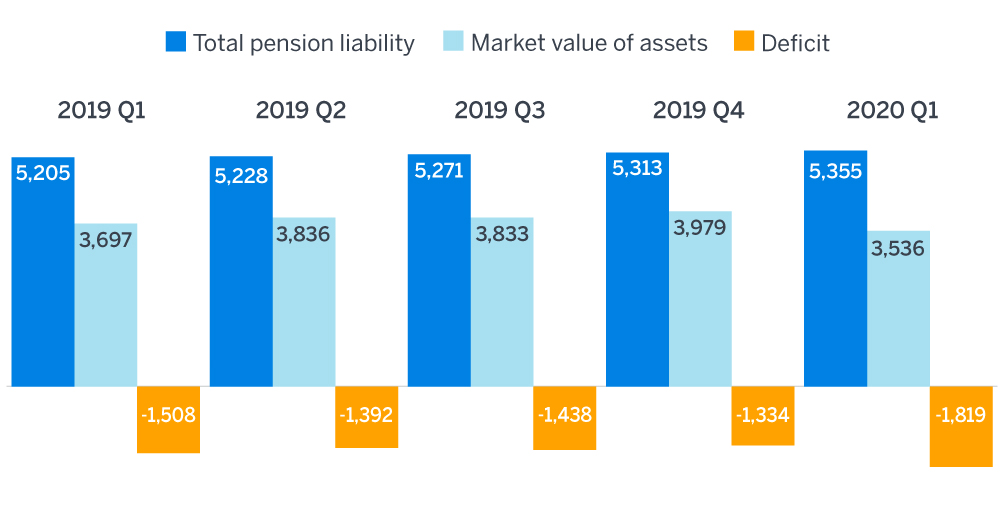
Right off the heels of a Q4 2019 high water mark for public pension assets, Q1 investment losses have lowered the estimated funded status of the 100 largest U.S. public pension plans as measured by the Milliman 100 Public Pension Funding Index (PPFI), from 74.9% at the end of December 2019 to 66.0% at the end of March 2020. The deficit ballooned to $1.819 trillion at the end of March 2020, up from $1.334 trillion at the end of December 2019. Plans are now at the lowest funding levels since the PPFI began in September 2016, eliminating all of the funding level improvements that were made in 2019.
Figure 1: Funded ratio

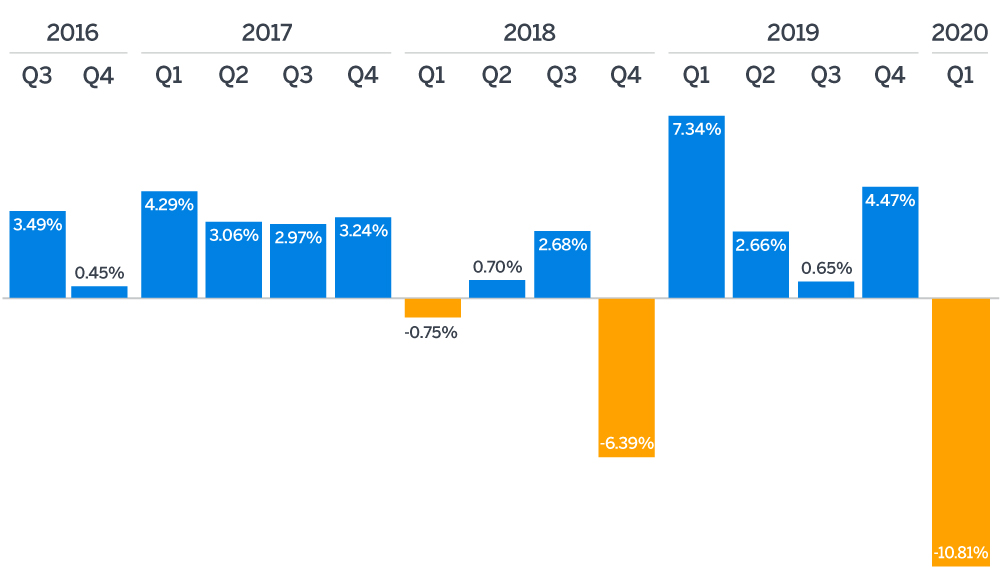
In aggregate, the PPFI plans experienced investment returns of -10.81% in Q1, with individual plans’ estimated returns ranging from -17.41% to 4.76%. The Milliman 100 PPFI asset value decreased from a PPFI high of $3.979 trillion at the end of Q4 2019 to a PPFI low of $3.536 trillion at the end of Q1 2020. The plans lost market value of approximately $419 billion, on top of net negative cash flow of approximately $24 billion.
Figure 2: Quarterly investment returns

The total pension liability (TPL) continues to grow and stood at an estimated $5.355 trillion at the end of Q1 2020, up from $5.313 trillion at the end of Q4 2019. Just as pension assets grow over time with investment income and shrink over time as benefits are paid, so too does the TPL grow over time with interest and shrink as benefits are paid. The TPL also grows as active members accrue pension benefits.
Figure 3: Quarterly funded status

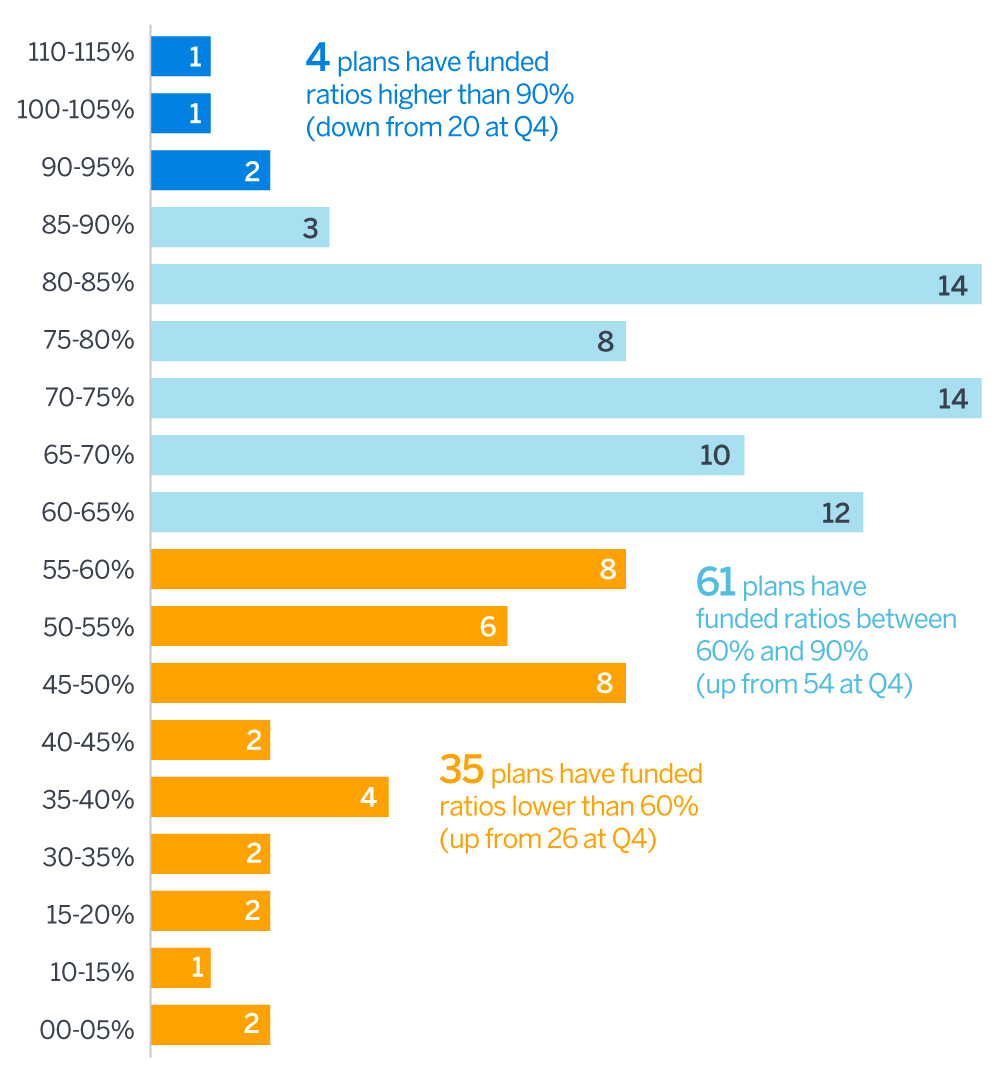
Funded ratios plunged this quarter, with 16 plans dropping below the 90% funded mark; just four plans still stand above this benchmark compared to 20 at the end of Q4 2019. Meanwhile, at the lower end of the spectrum nine plans fell below 60% funded, bringing the total number of plans under this mark to 35, up from just 26 at Q4 2019.
Figure 4: Funded ratios at March 31, 2019

About the Milliman 100 Public Pension Funding Index
Since 2012, Milliman has conducted an annual study of the 100 largest defined benefit plans sponsored by U.S. governments. The Milliman 100 Public Pension Funding Index projects the funded status for pension plans included in our study, reflecting the impact of actual market returns, utilizing the actual reported asset values, liabilities, and asset allocations of the pension plans.
The results of the Milliman 100 Public Pension Funding Index are based on the pension plan financial reporting information disclosed in the plan sponsors’ Comprehensive Annual Financial Reports, which reflect measurement dates ranging from June 30, 2016 to December 31, 2018. This information was summarized as part of the Milliman 2019 Public Pension Funding Study, which was published on January 20, 2020.
This quarterly update reflects adjustments made as of the end of June 2019 as part of Milliman’s annual Public Pension Funding Study, found at milliman.com/ppfs. The adjustments reflect updated publicly available asset and liability information gathered for the annual study.