Following the first annual reporting deadline under Solvency II, here's a look at the breakdown of risk components within the Solvency Capital Requirement (SCR) across the Irish market. This provides a useful insight into the largest drivers of regulatory capital, while also indicating some of the sources of risk for companies.
All companies
This analysis is based on 40 published Solvency and Financial Condition Reports (SFCRs) as only standard formula companies have been included. The graph in Figure 1 shows the breakdown of the various SCR components, where 100% represents the calculated SCR.
As can be seen, underwriting risk represents the largest driver of SCR, followed by market risk. In this case, underwriting risk represents a combination of life, health, and non-life underwriting risks.
The benefits of diversification and loss-absorbing capacity represent an average reduction of 43% of the SCR. Please note that diversification here is at the SCR module level and doesn't include the impact of diversification across sub-modules.
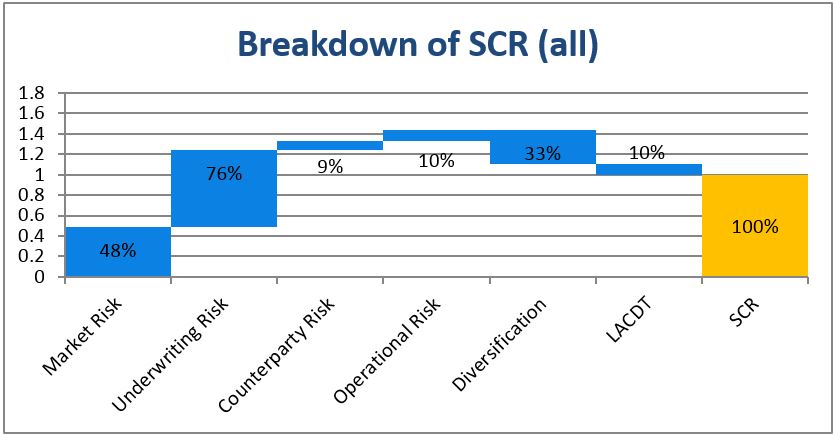
Figure 1
Life industry
It is useful to consider companies selling life business in isolation. We have included 24 published SFCRs within this category.
Figure 2 shows a broadly similar picture in these 24 reports to the overall industry graph in Figure 1 above.

Figure 2
The graphs in Figure 3 look at the same breakdown for individual companies. It is useful to look at cross-border life and domestic life companies separately. Underwriting risk and market risk are the two largest components for almost all companies. The diversification and loss-absorbing capacity of deferred taxes and technical provisions reduces the SCR to 100% in Figure 3.

Figure 3

Figure 4
Friends First Managed Pension Fund has been excluded from Figure 3 as it has since been transferred into Friends First Life Assurance Company.
Non-life industry
We have focused our analysis initially on domestic non-life companies selling in Ireland. When we look at non-life companies, in Figure 4, we see that the market risk of 41% is lower compared with the life graph in Figure 2 above (57%). On the other hand, underwriting risk (82%) is a little higher than for life companies (71%).

Figure 5
The breakdown by company, in Figure 5, shows that underwriting risk is the largest component for all companies.

Figure 6
Reinsurance industry
The breakdown of SCR components for reinsurers, shown in Figure 6, is again very similar to the overall market picture, with underwriting risk representing the largest component by far. As mentioned above, the underwriting risk of 82% represents a combination of life (44%), health (4%), and non-life (34%) underwriting risks.
The graph in Figure 7 shows that underwriting risk is the largest SCR component for all reinsurers. However, while market risk is the second largest component in most cases, counterparty risk comes in second for several reinsurers.

Figure 7

Figure 8