As governors implemented stay-at-home orders nationwide in March, the liability insurance industry experienced a widespread delay in litigation stemming from court closures. We can now begin to quantify the impact of court closures on litigation through a review of a database of attorney invoices submitted to liability insurance companies. 1 Invoices submitted to this database show a decline in court conferences of almost 90% for the second half of March when compared to the same period a year earlier. However, there has been little decline in defense costs to date as attorneys have repurposed themselves to other tasks.
Results of the analysis
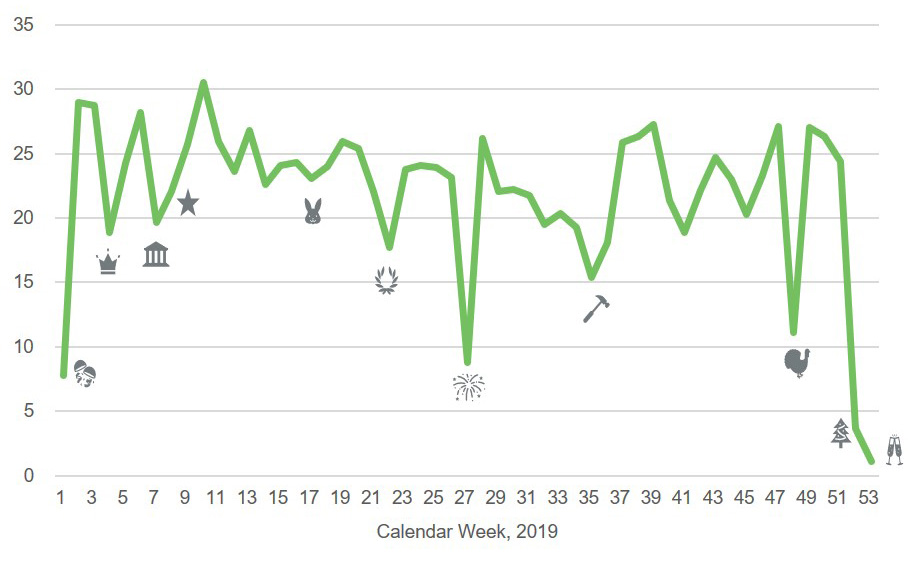
Of the 40,000 open cases processed monthly by the Milliman database, 16,000 are in lawsuit status. In 2019, there was an average of 22 court conferences weekly for every thousand open lawsuits. This average is generally predictable with much of the weekly variation explained by holidays.
Court conferences per 1,000 open lawsuits
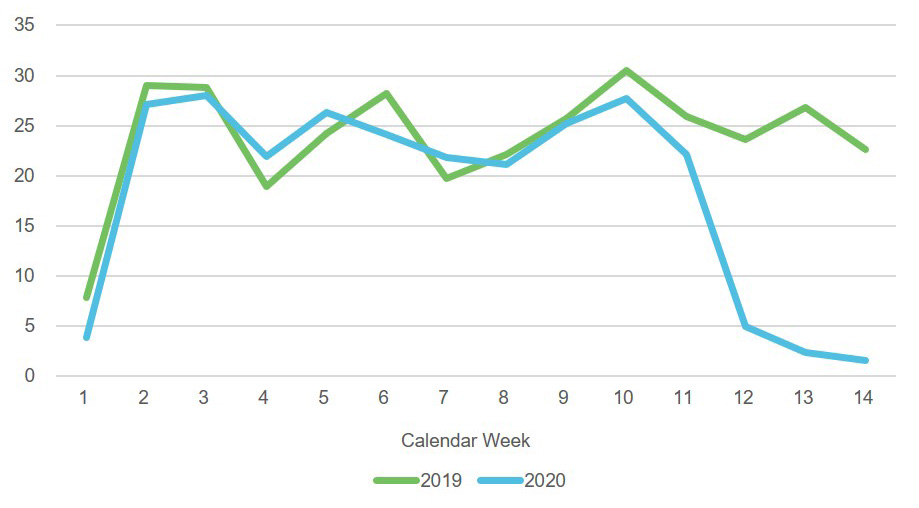
Court conferences in 2020 show a nearly identical pattern to 2019 through February, decline slightly in the first half of March, and then drop precipitously in the second half of the month.2 The decline in the first half of March is about 12% of the same time period for 2019. The decline for the second half of March is close to 90% of the prior year’s court conferences.
Court conferences per 1,000 open lawsuits
The count of court conferences is based on the text mining of line items to determine the billed service. A line item description of “appearance in court for compliance conference” or “attend status conference” are two among hundreds of variously worded descriptions indicating a court conference. Text mining can similarly be used to determine whether the conference was attended telephonically as indicated by an additional description like “via conference call” or by the lack of inclusion of travel time.
Portion of court conferences conducted telephonically
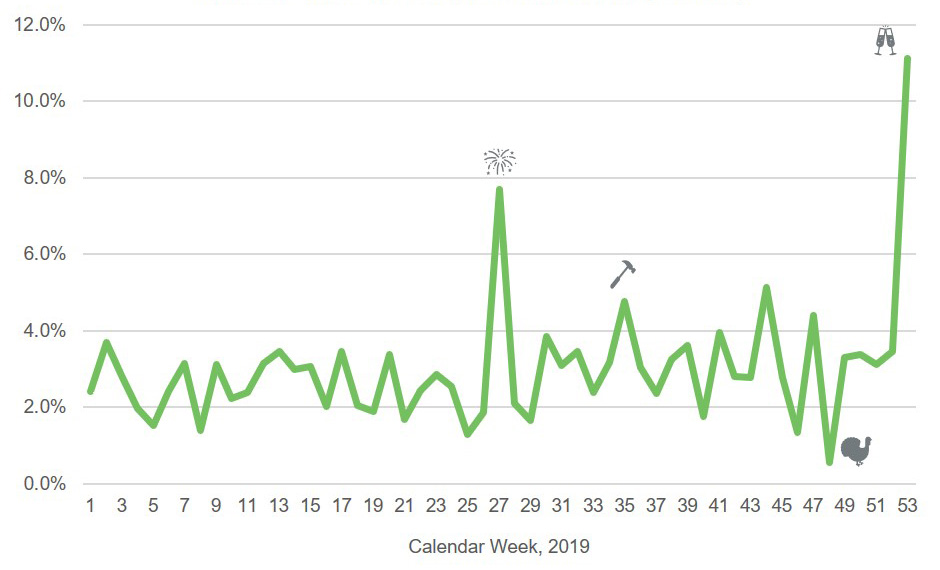
Like the number of conferences, holidays explain a large share of the variation in the telephonic portion.3 The portion conducted telephonically also varies regionally with about 12% conducted telephonically in California and 1.5% outside of California. Of those conferences that occurred in the second half of March this year, a large portion (24%) were telephonic.
Portion of court conferences conducted telephonically
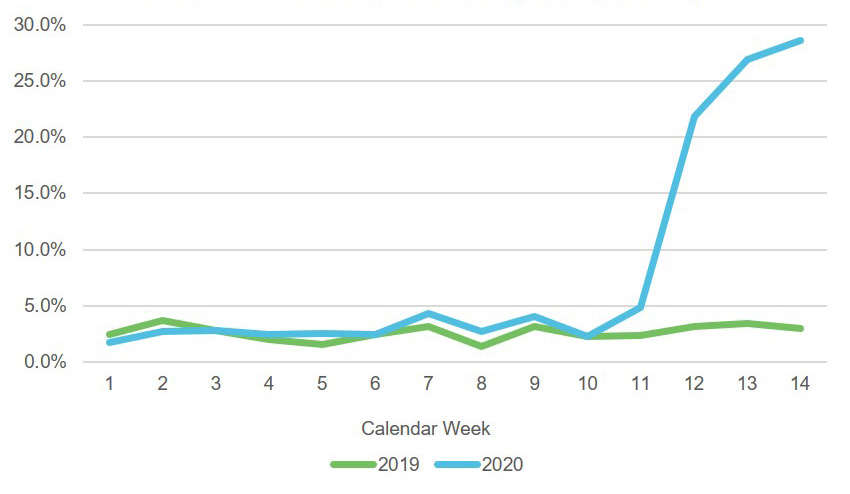
The telephonic portion in California was largely unchanged during March as a system for conducting conferences telephonically when feasible is well-established in this state. The increase above is driven by states outside of California. Telephonic court conferences lasted on average 64 minutes in 2019 while in-person court conferences lasted 133 minutes, slightly more than twice as long. This is likely due to the complexity and number of issues discussed, although there may also be a tendency to address issues more quickly via a call. 4
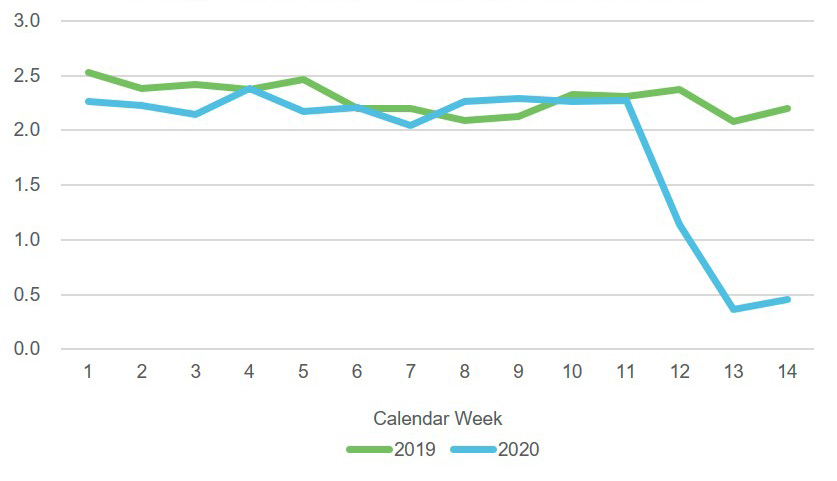
Among in-person court conferences, there is little variation in the average length of two and a quarter hours throughout the year. However, in the third week of March 2020, this average fell to about one hour, and then to about half an hour in the following weeks. This suggests these conferences were limited in scope and perhaps focused on addressing the expected delay due to COVID-19 rather than more complex issues.
Average length, in hours, of in-person court conferences
The implications for liability costs
The delay in litigation resulting from court closures is not news for liability insurers. However, the Milliman database suggests the possibility of quantifying this delay in ways companies would otherwise be unable. This is not to say the task will be easy. Anecdotally, plaintiff attorneys are more willing to settle currently; hence, the current environment could both slow and speed claims settlement. Continued analysis of the Milliman database may yield insights on settlement activity before this becomes apparent in case reserves or claim payments.
Also, while defense costs per case declined in March, the impact was small. A comparison to 2019 and the first two months of 2020 suggests that billed services in March may be 6% to 7% less than they otherwise would have been for this month.5 Attorneys have repurposed themselves to other tasks, including the investment of their time in continued settlement negotiations. It is unlikely that defense costs per claim will remain lower. If claims stay open longer due to court closures, we expect ultimate defense costs per claim will increase.
Billed services per open lawsuit
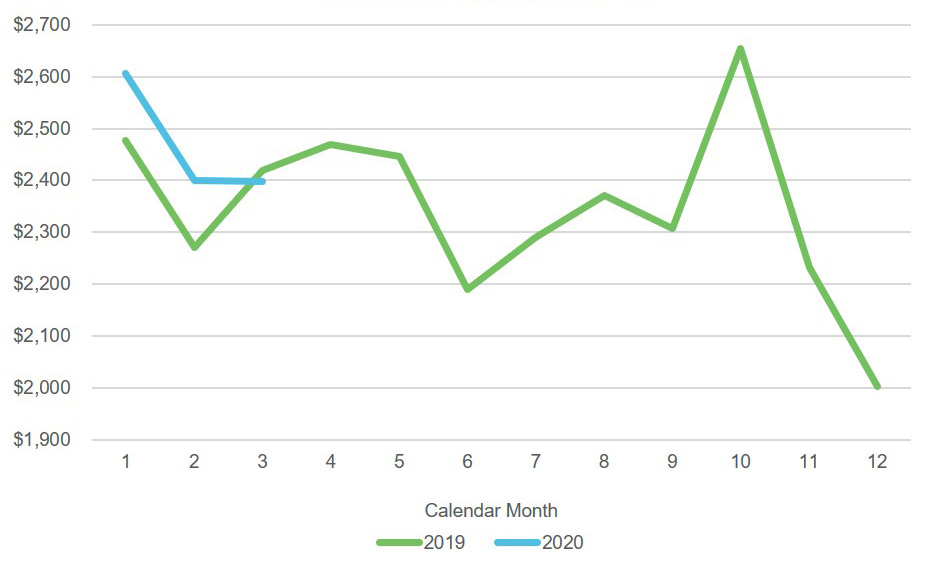
Despite the expectation of increased defense costs, traditional actuarial methods would project lower defense costs in the current environment due to the decline shown above. These methods are based in part on when a claim was reported, a metric that will mislead in the current environment due to litigation delays. Actuaries should consider adjustments to their methods to reflect these delays or consider methods based on factors other than the length of time since a claim has been reported.
Future research
In future articles, we will explore similar delays in depositions, oral arguments, and trials themselves. We will also explore whether text mining can provide insights on settlement negotiations and how their speed and outcome may be influenced by the current environment. As courts in certain states (but not others) re-open, we may be able to investigate regional differences in delays as well.
It will likely take at least as long to address the backlog of case activity as the length of time courts are closed. When courts re-open, criminal cases will be given priority due to the right to a speedy trial. Hence liability insurers should anticipate adjustments to reserving based on the reflection of litigation delays for an extended time period.
1Database compiled and maintained by Milliman Datalytics-Defense®.
2 Attorney invoices are most commonly submitted in the month following the date of service, but can be submitted later due to quarterly billing or other delays. The 2020 data is based on invoices submitted as of April 30, but reflects an estimate of court conferences not included in invoices as of this date based on past patterns of invoice submission.
3Unlike the number of conferences, holidays seem to influence the telephonic portion in both upward and downward directions. While this portion is typically higher during holiday weeks, during the week of Thanksgiving the portion conducted telephonically was at its minimum for the year. This suggests court conferences conducted during this week are of enough import to be held during the busiest travel season of the year and to be held in person.
4Regional variation cannot explain this difference as it is greater in California. Telephonic court conferences lasted on average 57 minutes in California in 2019, while in-person conferences lasted 145 minutes.
5Expenses are excluded from these comparisons. Billed services are based on amounts submitted through April 30, 2020, and are adjusted based on past patterns of invoice submission consistent with the projected conference count.
