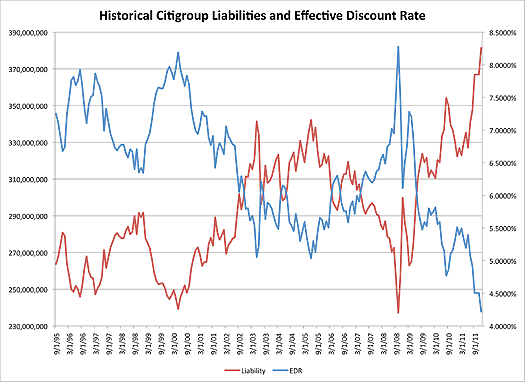
To illustrate how far discount rates have fallen, the graph below charts a typical plan's effective discount rate and liability using the same benefit payout stream for each month the Citigroup Yield Curve has been in existence (since September 1995). When discount rates are high, liabilities are low and vice versa.

As the graph shows, the effective discount rate (EDR) has fallen by over 100 basis points in the past calendar year. This one-year drop is not unprecedented; a 100-basis-point drop over a 12-month period has occurred multiple times, in periods of both recession and positive growth. However, this is the first time the effective discount rate has been under 5% for a sustained period. These historically low discount rates will lead to historically high pension plan liabilities that will be disclosed on end-of-2011 financial statements.
In addition to historically low discount rates, most pension plan assets underperformed their expected return during 2011. As a result, the Milliman 100 Pension Funding Index is projecting a record high funded status deficit. This is primarily due to an approximately 15%-20% increase in projected benefit obligation from December 31, 2010 to December 31, 2011. This will also impact 2012 expense results, as plans will see an increase in expense from 2011 for the same reasons.