Introduction
Centers for Medicare and Medicaid Services (CMS) Medicare cost reports are a near-comprehensive resource for hospital financial information in the United States. In this paper, we present all-payer approximate operating margins, occupancy rates, and state Medicaid relative reimbursement estimates.
These metrics can be used by facilities and payers to understand market dynamics, benchmark hospital performance, and compare results across facilities by market and facility type. The financial, utilization, and cost metrics can also assist in payment rate negotiations by providing transparency around a common set of metrics for hospital performance outcomes.
Medicare-certified institutional providers are required to submit an annual cost report containing detailed information regarding financial outcomes and operations. These reports are released quarterly by CMS in the Healthcare Cost Reporting Information System (HCRIS). Cost reports are available for different institution types such as hospitals, skilled nursing facilities, transplant hospitals, home health agencies, and rehabilitation hospitals. Milliman processes the hospital cost reports for short-term and critical access hospitals, pairs these data with benchmark measures metrics, and creates views at the facility, core-based statistical area (CBSA), state, facility subtype, and national levels. While reports are also present in the database for long-term, psych, and rehab facilities, we limit our analysis to acute hospitals only. Children’s hospitals and cancer hospitals tend to have limited reporting in the cost reports and are excluded in these cases. Data is self-reported by hospitals; though we use reasonableness checks and exclude outlier data.
Hospital operating margins
All-payer operating margin is the hospital margin across all governmental and commercial payers, as well as uninsured and self-paying individuals. An approximate operating margin is calculated for each fiscal year based on the total margin as reported in the hospital’s financial statements and reproduced in the cost reports, excluding the investment earnings and contribution components detailed in the cost reports. Our metric uses total revenue, which includes net patient service revenue and the additional revenue items reported outside of investments and contributions (e.g., parking, cafeteria, space rental).
Fiscal years are as defined by each hospital and can differ across providers. This definition may be particularly significant given the timing of COVID-19 impacts, because these major impacts were in the first half of 2020. The vast majority of hospitals would generally have seen this effect in fiscal year (FY) 2020 under the two most common fiscal year definitions (calendar year and July-June). To measure changes over time, we used a sample of approximately 3,350 U.S. hospitals, all of which met our data quality criteria for the entire FY2019-FY2022 period (there were approximately 4,700 acute hospitals reporting over the four-year period).
Hospital operating margins have changed materially through the COVID-19 pandemic era, with marked increases from FY2020 to FY2021, and material decreases from FY2021 to FY2022. Figure 1 shows the average operating margin across our sample of hospitals.
Figure 1: Hospital all-payer operating margins (FY2019-FY2022)
| Operating Margin Scenario | FY2019 | FY2020 | FY2021 | FY2022 |
|---|---|---|---|---|
| Including CARES Act Funds | 6.7% | 5.6% | 9.7% | 2.6% |
| Excluding CARES Act Funds | 6.7% | 2.2% | 8.0% | 1.8% |
As shown in Figure 1, hospital funding from the Coronavirus Aid, Relief, and Economic Security (CARES) Act contributed significantly to hospital margin performance in all three fiscal years. Figure 2 shows margins by hospital type.
Figure 2: Hospital all-payer operating margins (FY2019-FY2022)
| Hospital Type | Hospital Count | FY2019 | FY2020 | FY2021 | FY2022 |
|---|---|---|---|---|---|
| Academic Medical Center | 150 | 5.2% | 3.3% | 9.3% | 1.3% |
| Critical Access Hospitals | 997 | 3.3% | 5.3% | 11.1% | 4.8% |
| Minor Teaching Hospital | 266 | 6.6% | 5.6% | 8.7% | 2.5% |
| Short Term | 1,931 | 7.8% | 6.9% | 10.1% | 3.2% |
While the margin increase of FY2021 was driven by an 11.6% increase in revenue (compared to a 6.8% cost increase), the margin decrease for FY2022 was driven by a 9.4% increase in cost (compared to a 1.5% revenue increase). Year-over-year cost and revenue trends are shown in Figure 3.
Figure 3: Hospital all-payer cost and operating revenue trends (FY2019-FY2022)
| Trend | FY2019-2020 | FY2020-2021 | FY2021-2022 |
|---|---|---|---|
| Cost | 4.7% | 6.8% | 9.4% |
| Approx. Operating Revenue | 3.4% | 11.6% | 1.5% |
FY2022 margins were the lowest over the four-year period and had significant variation by state. Figure 4 shows state-level margins for FY2022, including CARES Act revenue.
Figure 4: All payer operating margin by state (FY2022)
Most states had approximate operating margins between -1% and 4% for FY2022, as noted by the 25th and 75th percentiles. The highest positive margins were in Utah (16.1%) and Alaska (12.6%), both of which have had consistently high margins over the entire four-year period. Most of the negative margin outliers were small states, with the exceptions of New York (-3.1%), Washington (-4.5%).
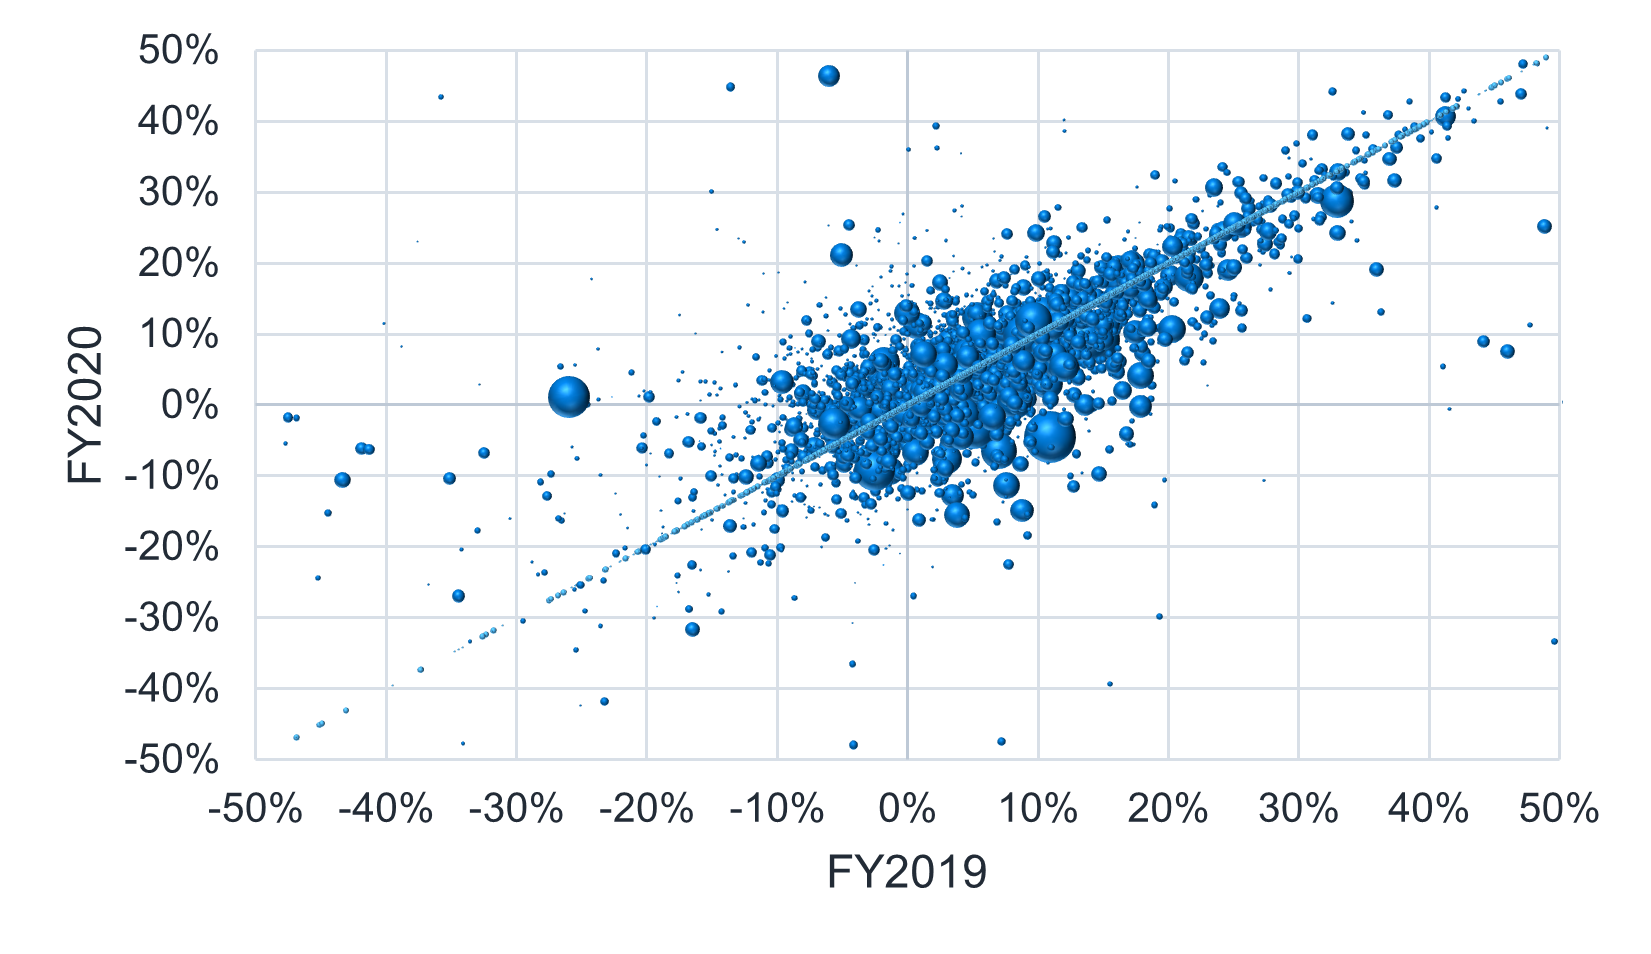
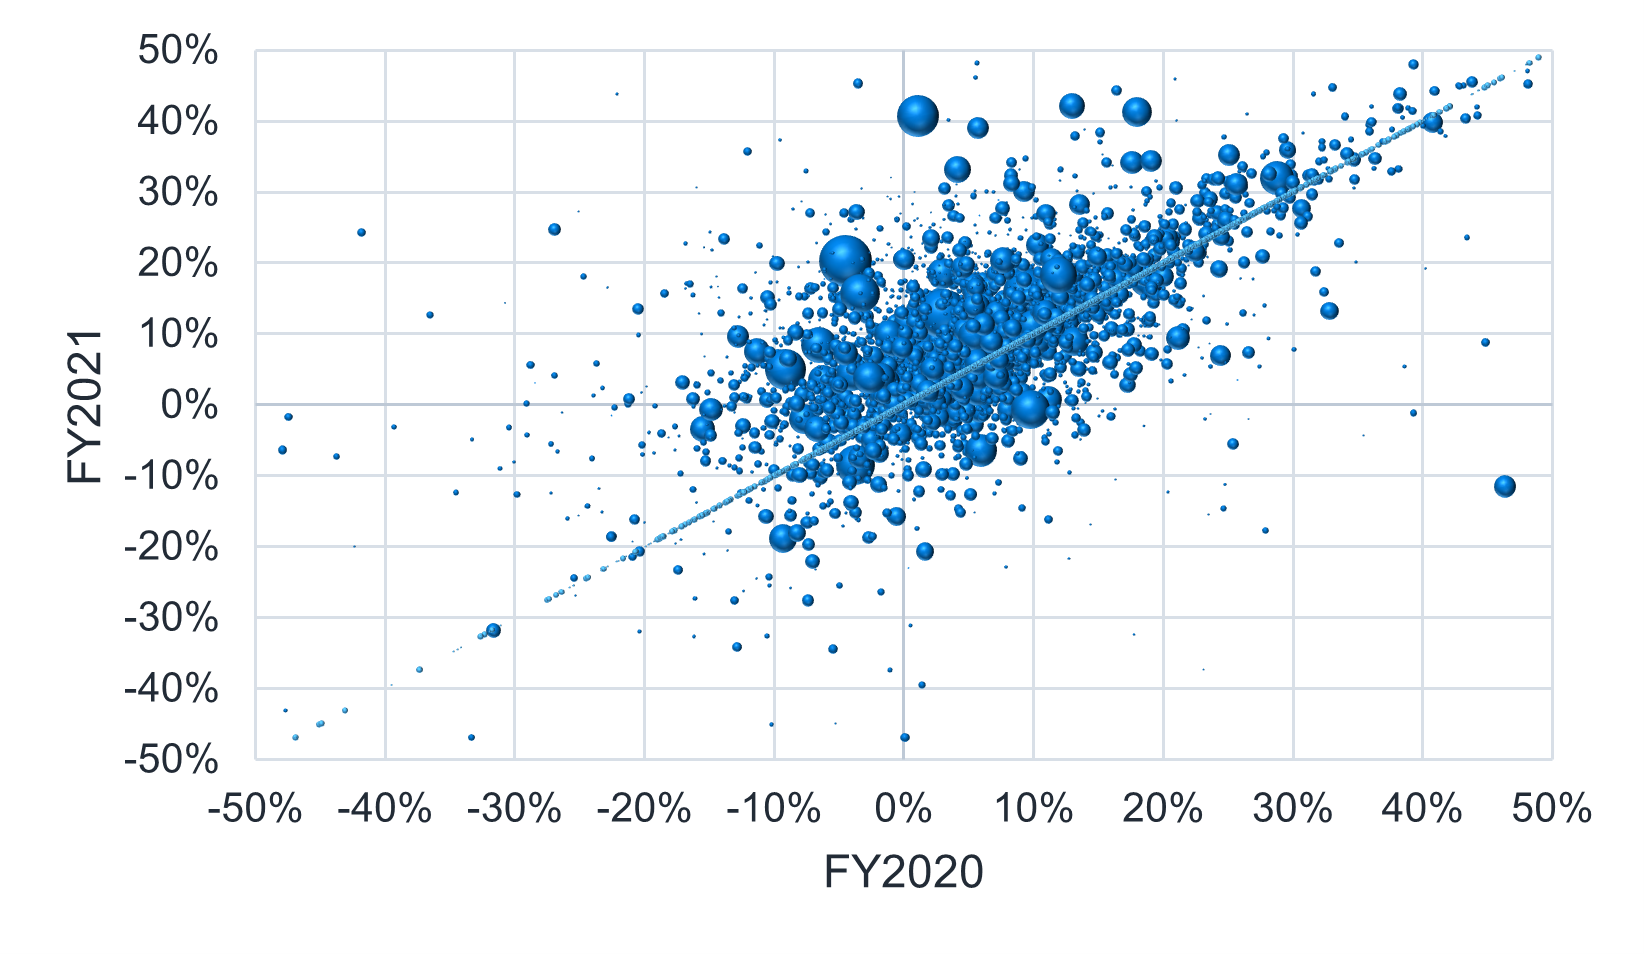
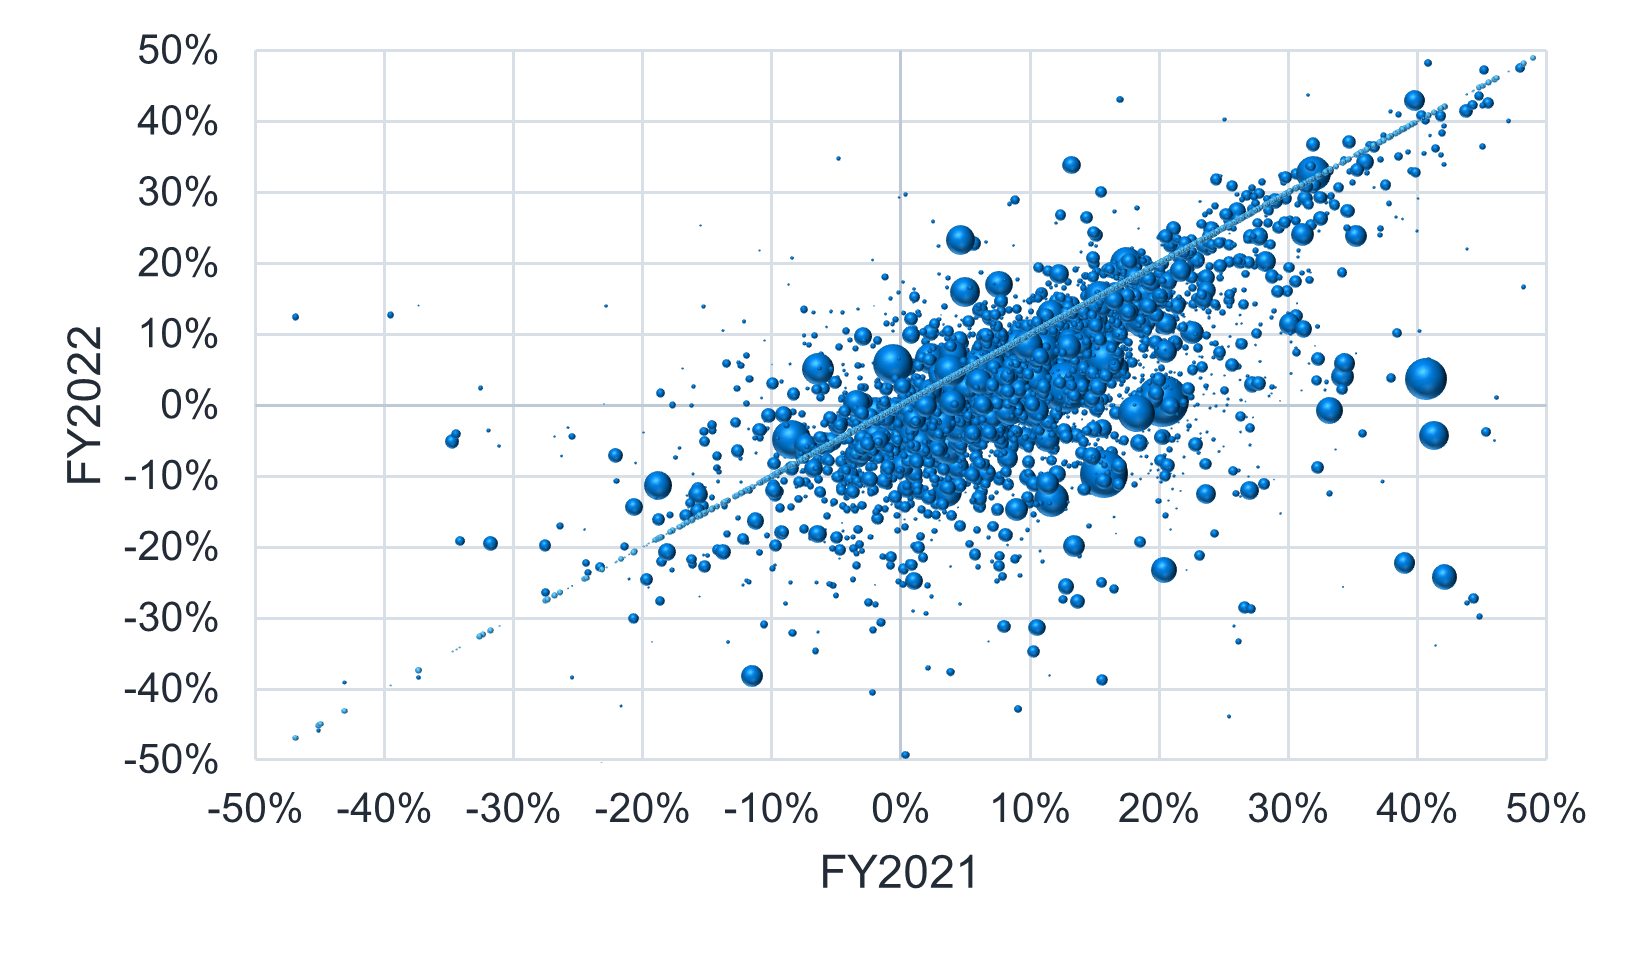
While the operating margins in Figures 1 and 2 show the aggregate operating margin change across the national sample, Figures 5, 6, and 7 show the distribution of margins at the hospital level, with year-over-year changes denoted by their position on the graph relative to the diagonal line. Hospital revenue is denoted by bubble size.
Hospitals on the diagonal line had little or no change in margin from year to year, while hospitals above the line had a favorable shift in margin and hospitals below the line had an unfavorable shift in margin. In summary:
- Above the diagonal line: Favorable change in margin.
- On the diagonal line: No change in margin.
- Below the diagonal line: Unfavorable change in margin.
While the FY2019 to FY2020 shifts are distributed relatively evenly around the “no change” line, more hospitals had favorable margin shifts in FY2021, and more hospitals had unfavorable shifts in FY2022. Reviewing state-by-state trends, coupled with the distribution of margin shifts from FY2021 to FY2022, the trend in hospital margins appears to be national, as opposed to being driven by a few localized areas.
Figure 5: Year-over-year margins (FY2019-FY2020)

Figure 6: Year-over-year margins (FY2020-FY2021)

Figure 7: Year-over-year margins (FY2021-FY2022)

Bed-days and occupancy
Hospital occupancy is measured as total occupied bed-days divided by total staffed bed-days. Figures 8 and 9 show the average occupancy rate for a sample of approximately 4,300 hospitals, along with staffed and occupied bed-day trends for the FY2019-FY2022 period.
Figure 8: Hospital occupancy (FY2019-FY2022)
| FY2019 | FY2020 | FY2021 | FY2022 |
|---|---|---|---|
| 62% | 59% | 63% | 64% |
Figure 9: Hospital bed-day trends (FY2019-FY2022)
| Trend | FY19-20 | FY20-21 | FY21-22 |
|---|---|---|---|
| Occupied Bed-Days | -3.6% | 7.1% | 1.9% |
| Staffed Bed-Days | 0.8% | 0.6% | 0.1% |
Hospital occupancy was lower during FY2020 across all hospitals, likely driven by deferred care during the initial months of the COVID-19 pandemic. Occupied beds dropped significantly from FY2019 to FY2020 and recovered in FY2021, while staffed beds increased moderately throughout the period. Occupancy also varies by hospital type, with academic hospitals having the highest occupancy and critical access hospitals having the lowest occupancy. Figure 10 shows annual occupancy by hospital type.
Figure 10: Hospital occupancy (FY2019-FY2022)
| Hospital Type | Hospital Count | FY2019 | FY2020 | FY2021 | FY2022 |
|---|---|---|---|---|---|
| Academic Medical Center | 152 | 79% | 75% | 80% | 81% |
| Cancer | 10 | 81% | 73% | 76% | 79% |
| Children's Hospitals | 57 | 67% | 61% | 63% | 66% |
| Critical Access Hospitals | 1,326 | 33% | 31% | 34% | 33% |
| Minor Teaching Hospital | 271 | 72% | 69% | 72% | 73% |
| Short Term | 2,423 | 56% | 54% | 58% | 59% |
Figure 11 shows the distribution of FY2022 hospital occupancy rate by state.
Figure 11: Hospital occupancy by state (FY2022)
Medicaid reimbursement
We estimate Medicaid reimbursement relative to Medicare based on the line of business-specific financial data for Medicaid and Medicare fee-for-service (FFS) for a sample of approximately 2,650 hospitals in the United States that meet our quality data criteria across the FY2019-FY2022 period.1
The cost reports contain revenue and cost information for each line of business (LOB), and we can approximate the relative reimbursement between Medicaid and Medicare FFS at the hospital level by using the ratio of revenue to cost for each line of business. While the revenue components are specific to each line of business, the cost estimates use billed charges and cost-to-charge ratios, both of which do not differ by line of business and can therefore be used as the common denominator for comparison.
While it is possible that both the department mix for Medicaid and Medicare FFS are different enough from a hospital’s all-payer profile and cost-to-charge ratios vary enough across department to skew the cost estimates between the two lines of business, CMS continues to have hospitals apply an all-payer cost-to-charge ratio to Medicaid and Medicare FFS billed charges for the calculation of uncompensated care costs. Our methodology is consistent with this treatment, and we expect that it will produce a reasonable estimate.
We produced the same Medicaid to Medicare FFS ratio metric at aggregate summary levels using the hospital-level revenue and cost information paired with additional information from Medicare FFS claims data. When aggregating Medicaid reimbursement across hospitals, reimbursement for each line of business is normalized for differences in case mix and intensity-adjusted cost efficiency between hospitals using Milliman Resource-Based Relative Value Scale (RBRVS) for HospitalsTM.2 The normalizing factor is a hospital efficiency metric based on cost per relative value unit (RVU); we apply Milliman RBRVS for hospitals to the Medicare FFS claims data along with Milliman’s cost reports-based claims costing tool to develop this metric.
Figure 12: Medicaid percentage of Medicare by state (FY2022)
The Medicaid reimbursement results presented above include supplemental and directed payments, because these payments are reported in the cost reports. In our experience, higher Medicaid reimbursement is typically found in states with significant supplemental or directed payment programs.
The majority of hospitals had average Medicaid reimbursement as a percentage of Medicare between 81% and 110%, as shown by the 25th and 75th percentiles in Figure 12. The highest outliers are Kentucky (159%) and Texas (155%), both of which had high Medicaid reimbursement prior to FY2021 and have added large directed payment programs within the last two years.3 Nevada has the lowest estimated reimbursement at 60% of Medicare.
Because the Medicaid reimbursement results presented above are shown relative to Medicare FFS reimbursement, lower relative reimbursement may also be found in areas with richer Medicare reimbursement, such as regions with a high concentration of academic medical institutions. Additionally, the variation in Medicaid reimbursement may be masked by differences in the Medicare hospital wage index (e.g., California hospitals on average have a higher hospital wage index than Indiana hospitals, which can lead to higher Medicare FFS reimbursement rates for California hospitals). Therefore, stakeholders may want to review Medicaid reimbursement on both a percentage-of-Medicare basis and as a pure case-mix-adjusted unit price relativity.4
Conclusions
This paper covers three main topics:
- Margins: On average, in FY2020 and FY2021 hospitals maintained margins similar to or above FY2019 levels. However, the expiration of the CARES Act funds, cost inflation pressures, and stagnant revenue contributed to a significant decline in average hospital margins for FY2022.
- Occupancy: Hospital occupancy declined in FY2020 but has since recovered to pre-pandemic levels.
- Medicaid reimbursement: Relative reimbursement for state Medicaid varies significantly across states, dependent on fee schedules, supplemental and directed payment programs, and regional Medicare reimbursement levels.
While the three topics above represent the areas of most frequently asked questions we see regarding the cost reports, there is significantly more depth and breadth of information available. Additional topics we have covered in our research using the database include commercial reimbursement relativities, uncompensated care costs, claim-level operating costs and margins, graduate medical education costs, payer mix, cost structure, claims costing, payer discounts, and organ acquisition costs, among many others.
For additional information, please contact your Milliman consultant.
1 Quality criteria excludes hospitals with outlier reported results for 2019 through 2022 total margin, line of business margin, and revenue. Additionally hospitals without without case-mix adjusted operating cost metrics are excluded. At the line of business level, hospitals are excluded if either Medicare losses exceed 100% of revenue, Medicaid losses exceed 200% of revenue, Medicare gains exceed 50% revenue, or Medicaid gains exceed 90% of revenue.
2 For more information on Milliman RBRVS for Hospitals please see: https://www.milliman.com/en/insight/milliman-rbrvs-for-hospitals-2022.
3 For Kentucky, see: kentucky.gov/Pages/Activity-stream.aspx?n=GovernorBeshear&prId=1122. For Texas, see: https://pfd.hhs.texas.gov/hospitals-clinic/hospital-services/comprehensive-hospital-increase-reimbursement-program.
4 Milliman’s GlobalRVUs and Medicare Repricer solutions support viewing unit price relativities on both a per RVU and a percentage-of-Medicare basis.


